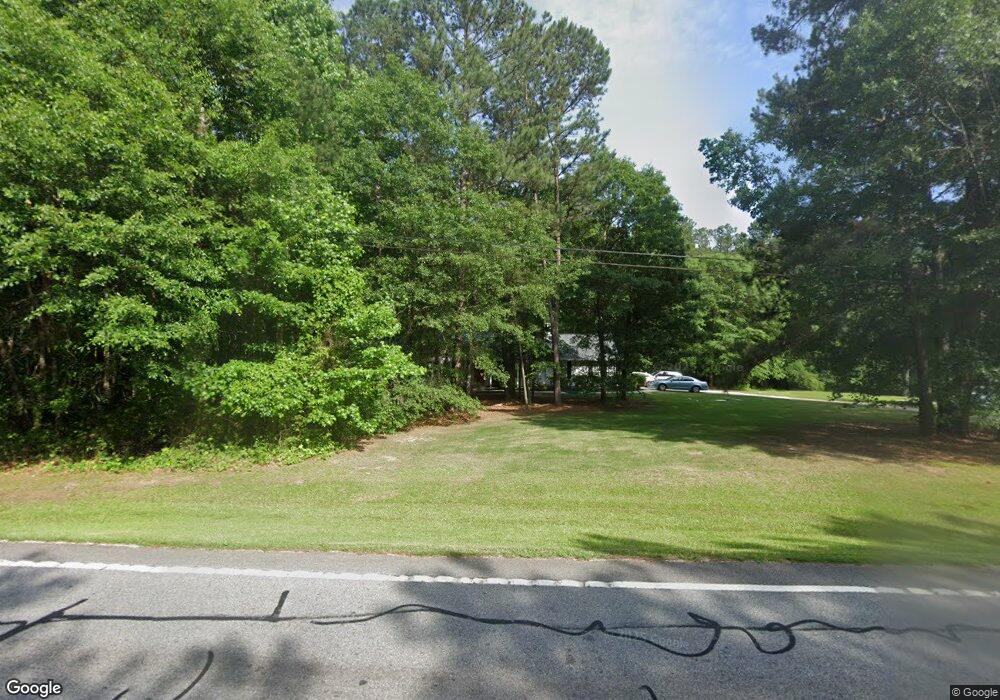
3043 Highway 16 E Sharpsburg, GA 30277
Estimated Value: $249,989 - $303,000
3
Beds
1
Bath
1,280
Sq Ft
$213/Sq Ft
Est. Value
About This Home
This home is located at 3043 Highway 16 E, Sharpsburg, GA 30277 and is currently estimated at $272,997, approximately $213 per square foot. 3043 Highway 16 E is a home located in Coweta County with nearby schools including Poplar Road Elementary School, East Coweta Middle School, and East Coweta High School.
Ownership History
Date
Name
Owned For
Owner Type
Purchase Details
Closed on
Apr 6, 2023
Sold by
Terrell Janice F
Bought by
Terrell Janice F and Parrott Sherice
Current Estimated Value
Purchase Details
Closed on
Feb 24, 1999
Bought by
Terrell Janice F
Purchase Details
Closed on
Mar 25, 1994
Sold by
Wood Prop
Bought by
Mcmichael Janice
Home Financials for this Owner
Home Financials are based on the most recent Mortgage that was taken out on this home.
Original Mortgage
$71,997
Interest Rate
7.2%
Mortgage Type
FHA
Purchase Details
Closed on
Dec 17, 1993
Bought by
Mark Wood Properties
Purchase Details
Closed on
Aug 20, 1993
Bought by
Ridgeview Ltd
Purchase Details
Closed on
Jun 8, 1993
Bought by
Bass Paul and Bass James A
Create a Home Valuation Report for This Property
The Home Valuation Report is an in-depth analysis detailing your home's value as well as a comparison with similar homes in the area
Home Values in the Area
Average Home Value in this Area
Purchase History
| Date | Buyer | Sale Price | Title Company |
|---|---|---|---|
| Terrell Janice F | -- | -- | |
| Terrell Janice F | -- | -- | |
| Mcmichael Janice | $73,100 | -- | |
| Mark Wood Properties | $20,000 | -- | |
| Ridgeview Ltd | $20,000 | -- | |
| Bass Paul | -- | -- |
Source: Public Records
Mortgage History
| Date | Status | Borrower | Loan Amount |
|---|---|---|---|
| Previous Owner | Mcmichael Janice | $71,997 |
Source: Public Records
Tax History Compared to Growth
Tax History
| Year | Tax Paid | Tax Assessment Tax Assessment Total Assessment is a certain percentage of the fair market value that is determined by local assessors to be the total taxable value of land and additions on the property. | Land | Improvement |
|---|---|---|---|---|
| 2025 | $573 | $78,888 | $13,033 | $65,856 |
| 2024 | $595 | $68,749 | $6,932 | $61,818 |
| 2023 | $595 | $57,633 | $6,359 | $51,274 |
| 2022 | $1,456 | $59,090 | $10,741 | $48,349 |
| 2021 | $1,386 | $52,642 | $10,741 | $41,901 |
| 2020 | $1,395 | $52,642 | $10,741 | $41,901 |
| 2019 | $1,228 | $41,944 | $9,545 | $32,399 |
| 2018 | $1,230 | $41,944 | $9,545 | $32,399 |
| 2017 | $1,229 | $41,944 | $9,545 | $32,399 |
| 2016 | $1,215 | $41,944 | $9,545 | $32,399 |
| 2015 | $1,194 | $41,944 | $9,545 | $32,399 |
| 2014 | $1,252 | $41,944 | $9,545 | $32,399 |
Source: Public Records
Map
Nearby Homes
- 2812 Highway 16 E
- 46 Lullwater Ct
- 68 Winchester Dr
- 65 Oakhurst Trail
- 69 Oakhurst Trail
- 316 Winchester Dr
- 2752 Poplar Rd
- 565 Timberbrook Dr
- 105 Turnberry Trace
- 108 Turnberry Trace
- 0 Poplar Rd Unit 10580891
- 465 Little Rd
- 25 Pacific Ave
- 9 Marvin Gardens
- 270 Sturgess Run
- 0 Cannon Rd Unit 7627017
- 0 Cannon Rd Unit 10566028
- 24 Marvin Gardens
- Camden Plan at Candleberry Place
- Savannah Plan at Candleberry Place
- 3041 Highway 16 E
- 3085 Highway 16 E
- 3085 Georgia 16
- 75 Orr Rd
- 91 Orr Rd
- 61 Orr Rd
- 2979 E Orr Rd
- 3100 Highway 16 E Unit F
- 3100 Highway 16 E Unit E
- 3100 Highway 16 E Unit A
- 3100 Highway 16 E Unit B
- 3100 Highway 16 E Unit A E
- 3100 Highway 16 E
- 3100 Georgia 16 Unit F
- 3100 Georgia 16 Unit E
- 0 Orr Rd Unit 10156208
- 0 Orr Rd Unit 7212330
- 0 Orr Rd Unit 7180274
- 0 Orr Rd Unit 10121984
- 0 Orr Rd Unit 10121977