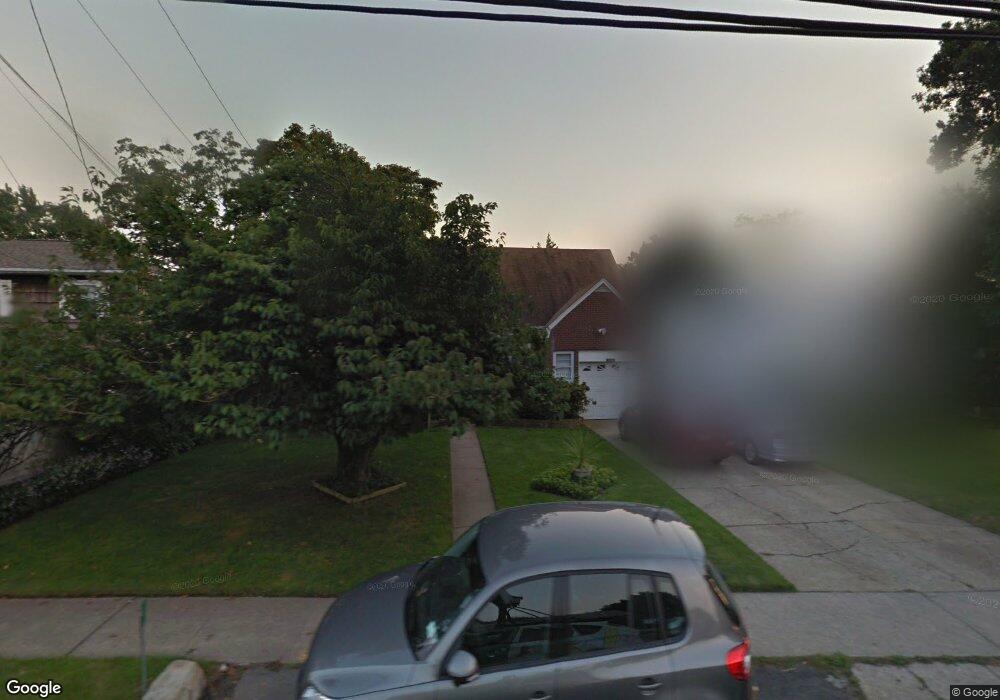
3044 Brower Ave Oceanside, NY 11572
Estimated Value: $690,875 - $736,000
4
Beds
2
Baths
1,606
Sq Ft
$444/Sq Ft
Est. Value
About This Home
This home is located at 3044 Brower Ave, Oceanside, NY 11572 and is currently estimated at $713,438, approximately $444 per square foot. 3044 Brower Ave is a home located in Nassau County with nearby schools including Oaks Elementary School - School 3, Oceanside Middle School, and Oceanside High School.
Ownership History
Date
Name
Owned For
Owner Type
Purchase Details
Closed on
Dec 13, 2021
Sold by
Colella Irina
Bought by
Colella Irina J and Koestner David
Current Estimated Value
Home Financials for this Owner
Home Financials are based on the most recent Mortgage that was taken out on this home.
Original Mortgage
$403,000
Outstanding Balance
$370,654
Interest Rate
3.11%
Mortgage Type
New Conventional
Estimated Equity
$342,784
Purchase Details
Closed on
May 11, 2015
Sold by
Schwasnick Michael
Bought by
Colella Irina
Home Financials for this Owner
Home Financials are based on the most recent Mortgage that was taken out on this home.
Original Mortgage
$334,757
Interest Rate
3.62%
Mortgage Type
FHA
Purchase Details
Closed on
Mar 7, 2012
Sold by
Mcsweeney Helen and Schwanick Helen
Bought by
Schwasnick Michael and Helen Mcsweeney Irrevocable Tr
Create a Home Valuation Report for This Property
The Home Valuation Report is an in-depth analysis detailing your home's value as well as a comparison with similar homes in the area
Home Values in the Area
Average Home Value in this Area
Purchase History
| Date | Buyer | Sale Price | Title Company |
|---|---|---|---|
| Colella Irina J | -- | Judicial Title | |
| Colella Irina | $349,000 | Safe Harbor | |
| Schwasnick Michael | -- | -- |
Source: Public Records
Mortgage History
| Date | Status | Borrower | Loan Amount |
|---|---|---|---|
| Open | Colella Irina J | $403,000 | |
| Closed | Colella Irina | $334,757 |
Source: Public Records
Tax History
| Year | Tax Paid | Tax Assessment Tax Assessment Total Assessment is a certain percentage of the fair market value that is determined by local assessors to be the total taxable value of land and additions on the property. | Land | Improvement |
|---|---|---|---|---|
| 2025 | $12,841 | $465 | $193 | $272 |
| 2024 | $3,485 | $451 | $187 | $264 |
| 2023 | $10,667 | $475 | $197 | $278 |
| 2022 | $10,667 | $475 | $197 | $278 |
| 2021 | $14,594 | $451 | $187 | $264 |
| 2020 | $9,449 | $490 | $469 | $21 |
| 2019 | $8,331 | $525 | $471 | $54 |
| 2018 | $8,454 | $560 | $0 | $0 |
| 2017 | $6,271 | $628 | $502 | $126 |
| 2016 | $9,437 | $628 | $433 | $195 |
| 2015 | $2,597 | $663 | $457 | $206 |
| 2014 | $2,597 | $663 | $457 | $206 |
| 2013 | $2,638 | $728 | $502 | $226 |
Source: Public Records
Map
Nearby Homes
- 30 Gifford Ave
- 3195 Nantucket Ln
- 222 Chance Dr
- 3354 Knight St
- 2860 Nicole Ct
- 2975 Oceanside Rd
- 2778 King St
- 3309 Skillman Ave
- 25 Sunnybrook Dr E
- 254 Elizabeth Ave
- 2941 Moreland Ave
- 3432 Bayfield Blvd
- 3251 Neptune Ave
- 613 Smith Place
- 528 Carpenter Ave
- 2730 Remsen St
- 3483 Frederick St
- 647 Lincoln St
- 197 Foxhurst Rd
- 2910 Yale Place
- 3050 Brower Ave
- 3079 Benjamin Rd
- 3093 Benjamin Rd
- 3056 Brower Ave
- 3061 David Ct
- 3045 Brower Ave
- 3051 Brower Ave
- 3062 Brower Ave
- 3099 Benjamin Rd
- 3015 Harvey Ave
- 3057 Brower Ave
- 3080 Benjamin Rd
- 3055 David Ct
- 3014 Brower Ave
- 3092 Benjamin Rd
- 3105 Benjamin Rd
- 3063 Brower Ave
- 3094 Benjamin Rd
- 3070 Ellen Terry Dr
- 3007 Harvey Ave
Your Personal Tour Guide
Ask me questions while you tour the home.