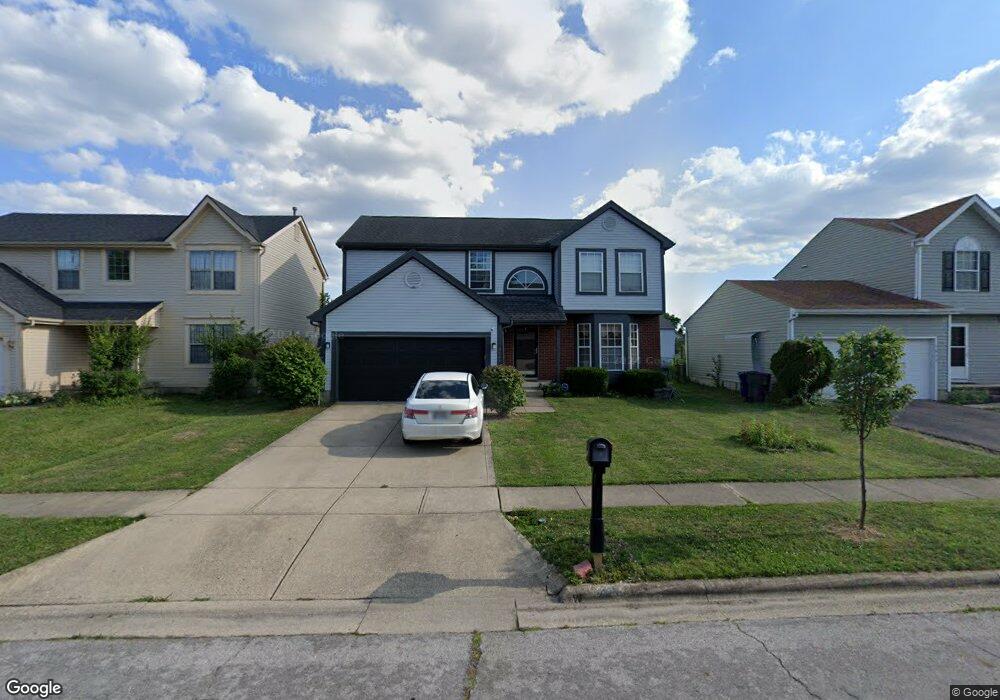
3045 Ambarwent Rd Reynoldsburg, OH 43068
Estimated Value: $337,274 - $372,000
3
Beds
3
Baths
2,112
Sq Ft
$169/Sq Ft
Est. Value
About This Home
This home is located at 3045 Ambarwent Rd, Reynoldsburg, OH 43068 and is currently estimated at $356,819, approximately $168 per square foot. 3045 Ambarwent Rd is a home located in Fairfield County with nearby schools including Tussing Elementary School, Harmon Middle School, and Pickerington Ridgeview Junior High School.
Ownership History
Date
Name
Owned For
Owner Type
Purchase Details
Closed on
Sep 8, 2022
Sold by
Butler Latanya M
Bought by
Mouyoyi Claude O and Ngueudjio Antoinnette B
Current Estimated Value
Home Financials for this Owner
Home Financials are based on the most recent Mortgage that was taken out on this home.
Original Mortgage
$294,566
Outstanding Balance
$281,355
Interest Rate
5.22%
Mortgage Type
Credit Line Revolving
Estimated Equity
$75,464
Purchase Details
Closed on
Aug 24, 2001
Sold by
Reese Charles R
Bought by
Butler Latanya M
Home Financials for this Owner
Home Financials are based on the most recent Mortgage that was taken out on this home.
Original Mortgage
$144,688
Interest Rate
7.28%
Mortgage Type
FHA
Purchase Details
Closed on
Sep 4, 1997
Sold by
Homewood Building Co
Bought by
Reece Charles R and Reece Patricia J
Home Financials for this Owner
Home Financials are based on the most recent Mortgage that was taken out on this home.
Original Mortgage
$126,650
Interest Rate
7.54%
Mortgage Type
FHA
Create a Home Valuation Report for This Property
The Home Valuation Report is an in-depth analysis detailing your home's value as well as a comparison with similar homes in the area
Home Values in the Area
Average Home Value in this Area
Purchase History
| Date | Buyer | Sale Price | Title Company |
|---|---|---|---|
| Mouyoyi Claude O | -- | -- | |
| Butler Latanya M | $147,000 | -- | |
| Reece Charles R | $130,962 | -- |
Source: Public Records
Mortgage History
| Date | Status | Borrower | Loan Amount |
|---|---|---|---|
| Open | Mouyoyi Claude O | $294,566 | |
| Previous Owner | Butler Latanya M | $144,688 | |
| Previous Owner | Reece Charles R | $126,650 |
Source: Public Records
Tax History Compared to Growth
Tax History
| Year | Tax Paid | Tax Assessment Tax Assessment Total Assessment is a certain percentage of the fair market value that is determined by local assessors to be the total taxable value of land and additions on the property. | Land | Improvement |
|---|---|---|---|---|
| 2024 | $8,072 | $81,990 | $10,920 | $71,070 |
| 2023 | $3,190 | $81,990 | $10,920 | $71,070 |
| 2022 | $3,277 | $84,020 | $10,920 | $73,100 |
| 2021 | $2,911 | $64,440 | $8,400 | $56,040 |
| 2020 | $2,944 | $64,440 | $8,400 | $56,040 |
| 2019 | $2,965 | $64,440 | $8,400 | $56,040 |
| 2018 | $2,538 | $49,470 | $7,700 | $41,770 |
| 2017 | $2,541 | $48,720 | $7,000 | $41,720 |
| 2016 | $2,521 | $48,720 | $7,000 | $41,720 |
| 2015 | $2,397 | $44,030 | $7,000 | $37,030 |
| 2014 | $2,360 | $44,030 | $7,000 | $37,030 |
| 2013 | $2,360 | $44,030 | $7,000 | $37,030 |
Source: Public Records
Map
Nearby Homes
- 3072 Bocastle Ct
- 3099 Ambarwent Rd
- 3021 Sumner Dr
- 6926 Bennell Dr
- 3124 Creighton Place
- 3188 Creighton Place
- 6775 Centennial Dr
- 3292 Draycott Ct
- 7350 Aplin Dr
- 3265 O'Heagra Dr
- 3133 Earlington Ln
- 2826-2828 Continental Dr
- 3205 Mahaffey Ct
- 3212 Southern Hills Dr
- 3233 Mahaffey Ct
- 3161 Innisbrook Ct
- 7287 Candlestone Dr
- 3358 Cargin Ct
- 6605 Hancock Ct
- 2909 Princeville Dr
- 3051 Ambarwent Rd
- 3039 Ambarwent Rd
- 3057 Ambarwent Rd
- 7012 Bryemar Dr
- 7018 Bryemar Dr
- 7006 Bryemar Dr
- 3038 Fayburrow Dr
- 3044 Faxburrow Dr
- 3063 Ambarwent Rd
- 3044 Fayburrow Dr
- 7024 Bryemar Dr
- 3050 Fayburrow Dr
- 3032 Ambarwent Rd
- 3024 Ambarwent Rd
- 7030 Bryemar Dr
- 3056 Fayburrow Dr
- 3069 Ambarwent Rd
- 3060 Ambarwent Rd
- 3018 Ambarwent Rd
- 7036 Bryemar Dr