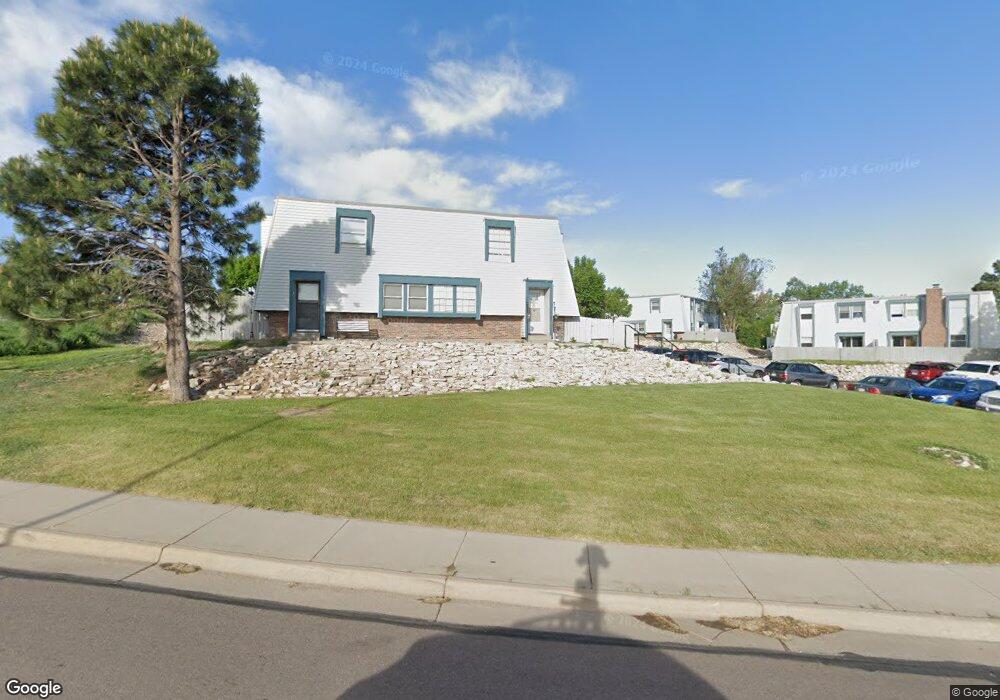
3045 E Fountain Blvd Unit 3045 Colorado Springs, CO 80910
Spring Creek NeighborhoodEstimated Value: $177,382 - $209,000
2
Beds
2
Baths
1,050
Sq Ft
$177/Sq Ft
Est. Value
About This Home
This home is located at 3045 E Fountain Blvd Unit 3045, Colorado Springs, CO 80910 and is currently estimated at $185,846, approximately $176 per square foot. 3045 E Fountain Blvd Unit 3045 is a home located in El Paso County with nearby schools including Monterey Elementary School, Carmel Middle School, and Harrison High School.
Ownership History
Date
Name
Owned For
Owner Type
Purchase Details
Closed on
Jul 31, 2020
Sold by
Garcia Anna
Bought by
Truong Tuan and Tran Tuyen
Current Estimated Value
Purchase Details
Closed on
Feb 28, 2017
Sold by
Singley Lindsay
Bought by
Garcia Anna
Home Financials for this Owner
Home Financials are based on the most recent Mortgage that was taken out on this home.
Original Mortgage
$70,000
Interest Rate
4.09%
Mortgage Type
Unknown
Purchase Details
Closed on
Jun 30, 2006
Sold by
Sollender Adele R
Bought by
Lincoln Lindsay S
Home Financials for this Owner
Home Financials are based on the most recent Mortgage that was taken out on this home.
Original Mortgage
$65,500
Interest Rate
6.63%
Mortgage Type
Unknown
Purchase Details
Closed on
Oct 1, 1981
Bought by
Garcia Anna
Create a Home Valuation Report for This Property
The Home Valuation Report is an in-depth analysis detailing your home's value as well as a comparison with similar homes in the area
Home Values in the Area
Average Home Value in this Area
Purchase History
| Date | Buyer | Sale Price | Title Company |
|---|---|---|---|
| Truong Tuan | $64,374 | Legacy Title Group Llc | |
| Garcia Anna | $70,000 | Heritage Title Co | |
| Singley Lindsay | -- | Heritage Title Co | |
| Lincoln Lindsay S | $65,500 | North Amer Title Co Of Co | |
| Garcia Anna | -- | -- |
Source: Public Records
Mortgage History
| Date | Status | Borrower | Loan Amount |
|---|---|---|---|
| Previous Owner | Garcia Anna | $70,000 | |
| Previous Owner | Lincoln Lindsay S | $65,500 |
Source: Public Records
Tax History Compared to Growth
Tax History
| Year | Tax Paid | Tax Assessment Tax Assessment Total Assessment is a certain percentage of the fair market value that is determined by local assessors to be the total taxable value of land and additions on the property. | Land | Improvement |
|---|---|---|---|---|
| 2025 | $517 | $12,320 | -- | -- |
| 2024 | $342 | $12,960 | $3,020 | $9,940 |
| 2022 | $371 | $6,870 | $1,710 | $5,160 |
| 2021 | $395 | $7,060 | $1,760 | $5,300 |
| 2020 | $366 | $5,610 | $1,000 | $4,610 |
| 2019 | $354 | $5,610 | $1,000 | $4,610 |
| 2018 | $240 | $3,650 | $610 | $3,040 |
| 2017 | $183 | $3,650 | $610 | $3,040 |
| 2016 | $188 | $3,530 | $480 | $3,050 |
| 2015 | $188 | $3,530 | $480 | $3,050 |
| 2014 | $240 | $4,450 | $640 | $3,810 |
Source: Public Records
Map
Nearby Homes
- 3043 E Fountain Blvd Unit 3043
- 3005 E Fountain Blvd
- 1115 Rainier Dr
- 1116 Server Dr
- 1218 Rushmore Dr
- 1135 Server Dr
- 901 Teal Ct
- 1184 Mazatlan Cir
- 1206 Yosemite Dr
- 1219 Quivira Dr
- 1354 Shenandoah Dr
- 1402 Yosemite Dr
- 841 Dawn Break Loop
- 1519 Saratoga Dr
- 1604 Rushmore Dr
- 818 S Circle Dr
- 810 S Circle Dr
- 3314 Valley hi Ave Unit A
- 1547 Server Dr
- 3472 Atlantic Dr
- 3047 E Fountain Blvd
- 3041 E Fountain Blvd Unit 3041
- 3031 E Fountain Blvd Unit 3031
- 3049 E Fountain Blvd Unit 3049
- 3055 E Fountain Blvd
- 3025 E Fountain Blvd
- 3027 E Fountain Blvd Unit 3027
- 3037 E Fountain Blvd
- 3051 E Fountain Blvd Unit 3051
- 3039 E Fountain Blvd Unit 3039
- 3053 E Fountain Blvd Unit 3053
- 3035 E Fountain Blvd
- 3033 E Fountain Blvd Unit 3033
- 3021 E Fountain Blvd Unit 3021
- 3023 E Fountain Blvd
- 3019 E Fountain Blvd
- 3017 E Fountain Blvd Unit 3017
- 3013 E Fountain Blvd
- 3011 E Fountain Blvd
- 3015 E Fountain Blvd