3045 Eckert Rd SE Lancaster, OH 43130
Estimated Value: $281,000 - $368,000
3
Beds
2
Baths
1,264
Sq Ft
$248/Sq Ft
Est. Value
About This Home
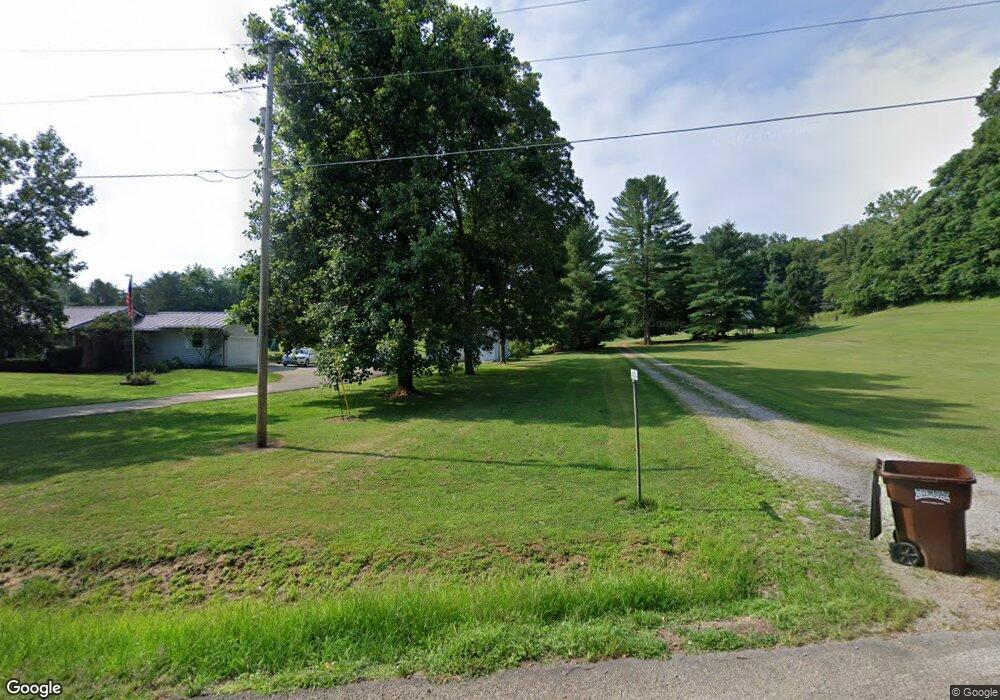
This home is located at 3045 Eckert Rd SE, Lancaster, OH 43130 and is currently estimated at $313,858, approximately $248 per square foot. 3045 Eckert Rd SE is a home located in Fairfield County with nearby schools including Berne Union Elementary School and Berne Union High School.
Ownership History
Date
Name
Owned For
Owner Type
Purchase Details
Closed on
Apr 4, 2023
Sold by
Kelly Brent A and Kelly Mary L
Bought by
Kelly Brent A and Kelly Mary L
Current Estimated Value
Purchase Details
Closed on
Jul 31, 2001
Sold by
Kelly Carl M
Bought by
Kelly Brent A and Kelly Mary L
Home Financials for this Owner
Home Financials are based on the most recent Mortgage that was taken out on this home.
Original Mortgage
$102,000
Interest Rate
6.76%
Mortgage Type
New Conventional
Purchase Details
Closed on
Sep 27, 1999
Sold by
Kelly Carl M
Bought by
Kelly Brent A and Kelly Mary L
Purchase Details
Closed on
Sep 18, 1998
Sold by
Justice Deborah E
Bought by
Kelly Carl M and Kelly Alvah M
Home Financials for this Owner
Home Financials are based on the most recent Mortgage that was taken out on this home.
Original Mortgage
$100,000
Interest Rate
6.71%
Mortgage Type
New Conventional
Create a Home Valuation Report for This Property
The Home Valuation Report is an in-depth analysis detailing your home's value as well as a comparison with similar homes in the area
Purchase History
| Date | Buyer | Sale Price | Title Company |
|---|---|---|---|
| Kelly Brent A | -- | None Listed On Document | |
| Kelly Brent A | $96,009 | -- | |
| Kelly Brent A | $96,009 | -- | |
| Kelly Carl M | $134,500 | -- |
Source: Public Records
Mortgage History
| Date | Status | Borrower | Loan Amount |
|---|---|---|---|
| Previous Owner | Kelly Brent A | $102,000 | |
| Previous Owner | Kelly Carl M | $100,000 |
Source: Public Records
Tax History
| Year | Tax Paid | Tax Assessment Tax Assessment Total Assessment is a certain percentage of the fair market value that is determined by local assessors to be the total taxable value of land and additions on the property. | Land | Improvement |
|---|---|---|---|---|
| 2025 | $5,885 | $110,140 | $24,850 | $85,290 |
| 2024 | $5,885 | $81,510 | $15,460 | $66,050 |
| 2023 | $2,173 | $81,510 | $15,460 | $66,050 |
| 2022 | $2,198 | $81,510 | $15,460 | $66,050 |
| 2021 | $1,646 | $61,180 | $13,440 | $47,740 |
| 2020 | $1,652 | $61,180 | $13,440 | $47,740 |
| 2019 | $1,656 | $61,180 | $13,440 | $47,740 |
| 2018 | $1,275 | $51,790 | $14,340 | $37,450 |
| 2017 | $1,191 | $51,790 | $14,340 | $37,450 |
| 2016 | $1,170 | $51,790 | $14,340 | $37,450 |
| 2015 | $1,136 | $50,230 | $14,340 | $35,890 |
| 2014 | $1,363 | $50,230 | $14,340 | $35,890 |
| 2013 | $1,363 | $50,230 | $14,340 | $35,890 |
Source: Public Records
Map
Nearby Homes
- 0 Wilson's Ln SE Unit Lot2
- 0 Wilson's Ln SE Unit Lot3
- 0 Wilson's Ln SE Unit Lot1
- 5440 Borah Hill Rd
- 513 Ross Rd SE
- 0 Hansley Rd SE
- 1570 E Main St Unit 60
- 144 Lynwood Ln
- 403 S Ewing St
- 0 E Main St Unit 225040917
- 1560 E Main St
- 0 Quarry Rd SE Unit 225041319
- 1106 E Walnut St
- 593 Ross Rd SE
- 1408 E Wheeling St
- 5288 Cincinnati Zanesville Rd NE
- 105 Dogwood Ln
- 0 Bis Rd SW Unit 225005143
- 846 E Main St
- 844 E Wheeling St
- 3075 Eckert Rd SE
- 3080 Eckert Rd SE
- 3022 Eckert Rd SE
- 3095 Eckert Rd SE
- 3094 Eckert Rd SE
- 3029 Eckert Rd SE
- 3110 Eckert Rd SE
- 3150 Eckert Rd SE
- 0 Eckert Rd SE Unit 212000752
- 0 Eckert Rd SE Unit 2729059
- 0 Eckert Rd SE Unit 2729057
- 2607 Eckert Rd SE
- 0 Eckert Rd SE Unit 2032363
- 0 Eckert Rd SE Unit 212040766
- 0 Eckert Rd SE Unit 211001206
- 0 Eckert Rd SE
- 3433 Eckert Rd SE
- 3173 Eckert Rd SE
- 3270 Eckert Rd SE