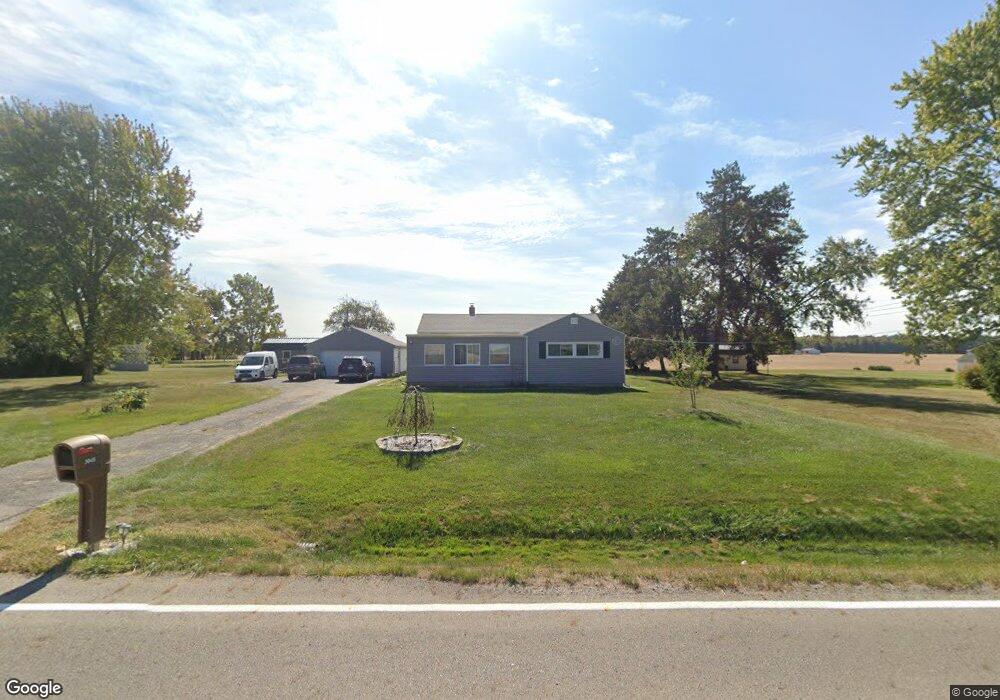
3045 Rocky Point Rd Springfield, OH 45502
Estimated Value: $154,000 - $329,000
3
Beds
1
Bath
1,256
Sq Ft
$189/Sq Ft
Est. Value
About This Home
This home is located at 3045 Rocky Point Rd, Springfield, OH 45502 and is currently estimated at $236,916, approximately $188 per square foot. 3045 Rocky Point Rd is a home located in Clark County with nearby schools including Greenon Elementary School, Greenon Jr. High School, and Greenon High School.
Ownership History
Date
Name
Owned For
Owner Type
Purchase Details
Closed on
Nov 13, 2018
Sold by
Cain Patricia L
Bought by
Cain Dennis P and Cain Patricia L
Current Estimated Value
Purchase Details
Closed on
Jun 19, 2017
Sold by
Torsell A Joseph
Bought by
Cain Patricia L
Home Financials for this Owner
Home Financials are based on the most recent Mortgage that was taken out on this home.
Original Mortgage
$79,797
Outstanding Balance
$65,894
Interest Rate
4.02%
Mortgage Type
Future Advance Clause Open End Mortgage
Estimated Equity
$171,022
Purchase Details
Closed on
Feb 23, 1998
Sold by
Rust Raymond W and Rust Mary E
Bought by
Torsell A Joseph
Home Financials for this Owner
Home Financials are based on the most recent Mortgage that was taken out on this home.
Original Mortgage
$55,000
Interest Rate
6.95%
Create a Home Valuation Report for This Property
The Home Valuation Report is an in-depth analysis detailing your home's value as well as a comparison with similar homes in the area
Purchase History
| Date | Buyer | Sale Price | Title Company |
|---|---|---|---|
| Cain Dennis P | -- | Ohio Real Estate Title Hold | |
| Cain Patricia L | $79,000 | Ohio Real Estate Title | |
| Torsell A Joseph | $80,000 | -- |
Source: Public Records
Mortgage History
| Date | Status | Borrower | Loan Amount |
|---|---|---|---|
| Open | Cain Patricia L | $79,797 | |
| Previous Owner | Torsell A Joseph | $55,000 |
Source: Public Records
Tax History
| Year | Tax Paid | Tax Assessment Tax Assessment Total Assessment is a certain percentage of the fair market value that is determined by local assessors to be the total taxable value of land and additions on the property. | Land | Improvement |
|---|---|---|---|---|
| 2025 | $2,315 | $67,190 | $15,870 | $51,320 |
| 2024 | $2,293 | $53,030 | $14,320 | $38,710 |
| 2023 | $2,293 | $53,030 | $14,320 | $38,710 |
| 2022 | $2,313 | $53,030 | $14,320 | $38,710 |
| 2021 | $1,699 | $37,580 | $10,370 | $27,210 |
| 2020 | $2,220 | $37,580 | $10,370 | $27,210 |
| 2019 | $2,264 | $37,800 | $10,370 | $27,430 |
| 2018 | $2,107 | $34,400 | $9,510 | $24,890 |
| 2017 | $2,112 | $34,402 | $9,510 | $24,892 |
| 2016 | $1,841 | $34,402 | $9,510 | $24,892 |
| 2015 | $1,724 | $31,052 | $8,645 | $22,407 |
| 2014 | $1,727 | $31,052 | $8,645 | $22,407 |
| 2013 | $1,519 | $31,052 | $8,645 | $22,407 |
Source: Public Records
Map
Nearby Homes
- 2170 Fairfield Pike
- 3864 Quailhollow Ct
- 3190 Rebert Pike
- 5152 S Tecumseh Rd
- 1448 W Sparrow Rd
- 2925 S Tecumseh Rd
- 2642 Springfield Xenia Rd
- 414 W Sparrow Rd
- 703 Dorchester Dr
- 1513 Ridgeway Dr
- 2301 Duquesne Dr
- 2531 W Jackson Rd
- Tract 3 W Jackson Rd
- 1421 Seminole Ave
- Tract 2 W Jackson Rd
- 1290 Red Oaks Cir
- 2140 Shawnee Ave
- 2801 S Springfield Jamestown St
- 2000 Springmont Ave
- 3319 Wendover St
- 3065 Rocky Point Rd
- 2782 Fairfield Pike
- 3079 Rocky Point Rd
- 3010 Rocky Point Rd
- 3062 Rocky Point Rd
- 3087 Rocky Point Rd
- 3082 Rocky Point Rd
- 2763 Fairfield Pike
- 2811 Fairfield Pike
- 2740 Faifield Pike
- 3100 Rocky Point Rd
- 3117 Rocky Point Rd
- 3139 Rocky Point Rd
- 3130 Rocky Point Rd
- 2720 Fairfield Pike
- 3200 Rocky Point Rd
- 3159 Rocky Point Rd
- 2700 Fairfield Pike
- 3210 Rocky Point Rd
- 3175 Rocky Point Rd
Your Personal Tour Guide
Ask me questions while you tour the home.