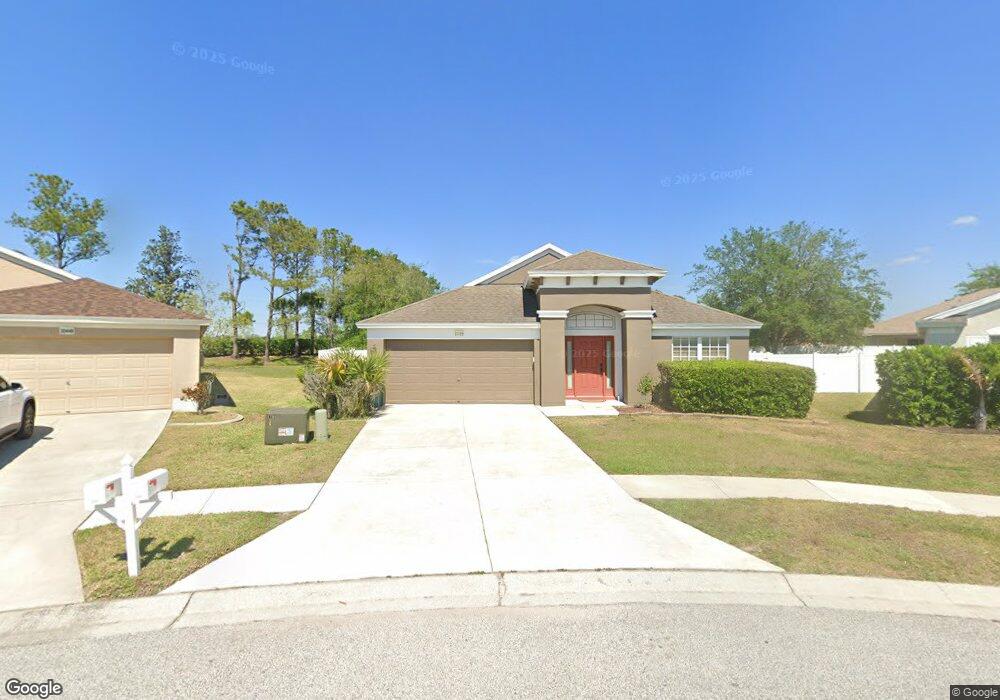
30455 Randall Manor St Wesley Chapel, FL 33545
Estimated Value: $389,066 - $407,000
4
Beds
2
Baths
1,956
Sq Ft
$203/Sq Ft
Est. Value
About This Home
This home is located at 30455 Randall Manor St, Wesley Chapel, FL 33545 and is currently estimated at $396,517, approximately $202 per square foot. 30455 Randall Manor St is a home located in Pasco County with nearby schools including Wesley Chapel Elementary School, Thomas E. Weightman Middle School, and Wesley Chapel High School.
Ownership History
Date
Name
Owned For
Owner Type
Purchase Details
Closed on
Jun 16, 2017
Sold by
Albertson Robert and Albertson Linda
Bought by
Turner Ii Timothy L and Turner Faith A
Current Estimated Value
Home Financials for this Owner
Home Financials are based on the most recent Mortgage that was taken out on this home.
Original Mortgage
$213,430
Outstanding Balance
$177,675
Interest Rate
4.05%
Mortgage Type
FHA
Estimated Equity
$218,842
Purchase Details
Closed on
Jul 6, 2011
Sold by
Region Bank
Bought by
Albertson Robert and Albertson Linda
Purchase Details
Closed on
Jan 4, 2011
Sold by
Wong David L
Bought by
Regions Bank
Purchase Details
Closed on
Jun 17, 2005
Sold by
Pulte Home Corp
Bought by
Wong David L
Home Financials for this Owner
Home Financials are based on the most recent Mortgage that was taken out on this home.
Original Mortgage
$149,404
Interest Rate
5.12%
Mortgage Type
Fannie Mae Freddie Mac
Create a Home Valuation Report for This Property
The Home Valuation Report is an in-depth analysis detailing your home's value as well as a comparison with similar homes in the area
Home Values in the Area
Average Home Value in this Area
Purchase History
| Date | Buyer | Sale Price | Title Company |
|---|---|---|---|
| Turner Ii Timothy L | $228,000 | Hillsborough Title Iii Llc | |
| Albertson Robert | $135,000 | Star Title Partners Of Tampa | |
| Regions Bank | $96,100 | Attorney | |
| Wong David L | $186,755 | Phc Title Corporation |
Source: Public Records
Mortgage History
| Date | Status | Borrower | Loan Amount |
|---|---|---|---|
| Open | Turner Ii Timothy L | $213,430 | |
| Previous Owner | Wong David L | $149,404 |
Source: Public Records
Tax History Compared to Growth
Tax History
| Year | Tax Paid | Tax Assessment Tax Assessment Total Assessment is a certain percentage of the fair market value that is determined by local assessors to be the total taxable value of land and additions on the property. | Land | Improvement |
|---|---|---|---|---|
| 2025 | $3,258 | $227,440 | -- | -- |
| 2024 | $3,258 | $221,030 | -- | -- |
| 2023 | $3,133 | $214,600 | $57,281 | $157,319 |
| 2022 | $2,810 | $208,350 | $0 | $0 |
| 2021 | $2,754 | $202,290 | $43,666 | $158,624 |
| 2020 | $2,707 | $199,500 | $37,452 | $162,048 |
| 2019 | $2,658 | $195,018 | $0 | $0 |
| 2018 | $2,606 | $191,382 | $37,452 | $153,930 |
| 2017 | $3,086 | $177,610 | $37,452 | $140,158 |
| 2016 | $2,814 | $160,932 | $37,452 | $123,480 |
| 2015 | $2,631 | $146,899 | $37,452 | $109,447 |
| 2014 | $1,421 | $135,668 | $35,592 | $100,076 |
Source: Public Records
Map
Nearby Homes
- 30526 Annadale Dr
- 30552 Latourette Dr
- 30547 Casewell Place
- 30652 Palmerston Place
- 7653 Outerbridge St
- 7737 Atwood Dr
- 7852 Stoney Hill Dr
- 30647 Elam Rd
- 7641 Armonk Ln
- 8342 Fussell Dr
- 30732 Summer Sun Loop
- 30862 Parrot Reef Ct
- 30770 Penny Surf Loop
- 7537 Rooks Dr
- 30753 Penny Surf Loop
- 30943 Parrot Reef Ct
- 30150 Overpass Rd
- 30935 Penny Surf Loop
- 30737 Elam Rd
- 7412 Sky Dr
- 30501 Randall Manor St
- 30449 Randall Manor St
- 30507 Randall Manor St
- 30443 Randall Manor St
- 30517 Latourette Dr
- 30521 Latourette Dr
- 30440 Randall Manor St
- 30437 Randall Manor St
- 30513 Randall Manor St
- 30513 Latourette Dr
- 30432 Randall Manor St
- 30507 Latourette Dr
- 30431 Randall Manor St
- 30519 Randall Manor St
- 30441 Annadale Dr
- 30525 Latourette Dr
- 30428 Randall Manor St
- 30501 Latourette Dr
- 30425 Randall Manor St
- 30435 Annadale Dr