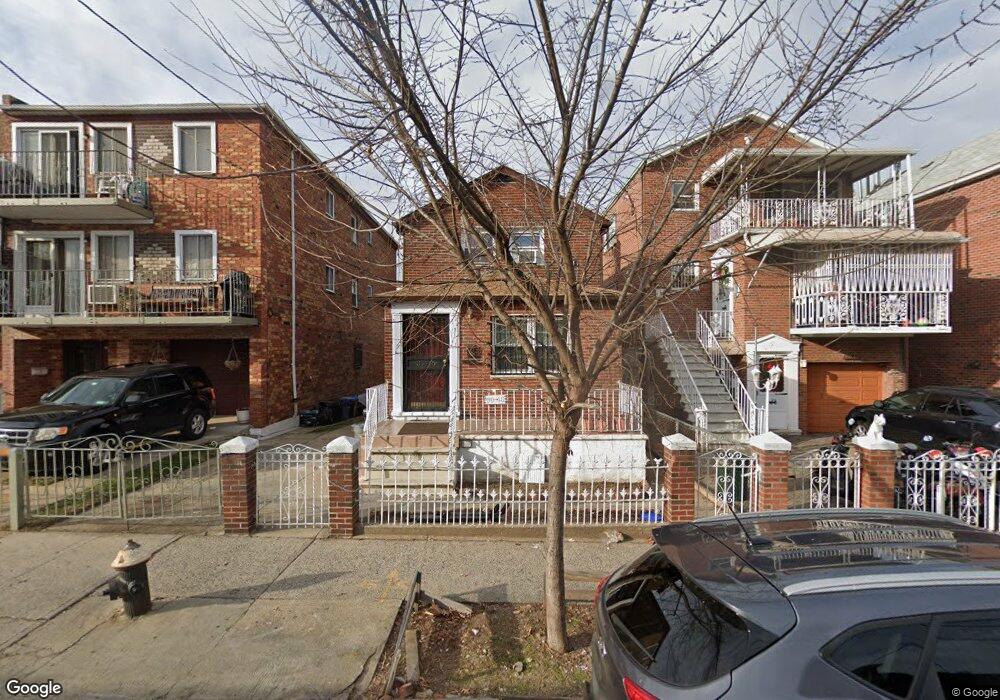
3046 81st St East Elmhurst, NY 11370
Jackson Heights NeighborhoodEstimated Value: $976,000 - $1,191,000
--
Bed
--
Bath
1,400
Sq Ft
$755/Sq Ft
Est. Value
About This Home
This home is located at 3046 81st St, East Elmhurst, NY 11370 and is currently estimated at $1,057,318, approximately $755 per square foot. 3046 81st St is a home located in Queens County with nearby schools including P.S. 2 Alfred Zimberg, Is 141 The Steinway, and William Cullen Bryant High School.
Ownership History
Date
Name
Owned For
Owner Type
Purchase Details
Closed on
Mar 14, 2006
Sold by
Kaur Hardeep and Nakhwal Joginder
Bought by
Nakhwal Joginder and Rani Asha
Current Estimated Value
Purchase Details
Closed on
Apr 11, 2002
Sold by
Diamint Julio and Diamint Esther Rosa
Bought by
Nakhwal Joginder and Rani Asha
Home Financials for this Owner
Home Financials are based on the most recent Mortgage that was taken out on this home.
Original Mortgage
$288,000
Outstanding Balance
$122,537
Interest Rate
7.18%
Estimated Equity
$934,781
Create a Home Valuation Report for This Property
The Home Valuation Report is an in-depth analysis detailing your home's value as well as a comparison with similar homes in the area
Home Values in the Area
Average Home Value in this Area
Purchase History
| Date | Buyer | Sale Price | Title Company |
|---|---|---|---|
| Nakhwal Joginder | -- | -- | |
| Nakhwal Joginder | -- | -- | |
| Nakhwal Joginder | -- | -- | |
| Nakhwal Joginder | -- | -- |
Source: Public Records
Mortgage History
| Date | Status | Borrower | Loan Amount |
|---|---|---|---|
| Open | Nakhwal Joginder | $288,000 | |
| Closed | Nakhwal Joginder | $288,000 |
Source: Public Records
Tax History Compared to Growth
Tax History
| Year | Tax Paid | Tax Assessment Tax Assessment Total Assessment is a certain percentage of the fair market value that is determined by local assessors to be the total taxable value of land and additions on the property. | Land | Improvement |
|---|---|---|---|---|
| 2025 | $8,755 | $46,208 | $12,836 | $33,372 |
| 2024 | $4,378 | $43,592 | $13,053 | $30,539 |
| 2023 | $8,396 | $41,803 | $12,941 | $28,862 |
| 2022 | $7,787 | $46,440 | $15,900 | $30,540 |
| 2021 | $8,590 | $49,680 | $15,900 | $33,780 |
| 2020 | $8,151 | $48,660 | $15,900 | $32,760 |
| 2019 | $7,599 | $46,620 | $15,900 | $30,720 |
| 2018 | $7,101 | $34,836 | $11,244 | $23,592 |
| 2017 | $7,000 | $34,338 | $12,727 | $21,611 |
| 2016 | $6,800 | $34,338 | $12,727 | $21,611 |
| 2015 | $3,687 | $32,089 | $13,057 | $19,032 |
| 2014 | $3,687 | $30,273 | $13,389 | $16,884 |
Source: Public Records
Map
Nearby Homes