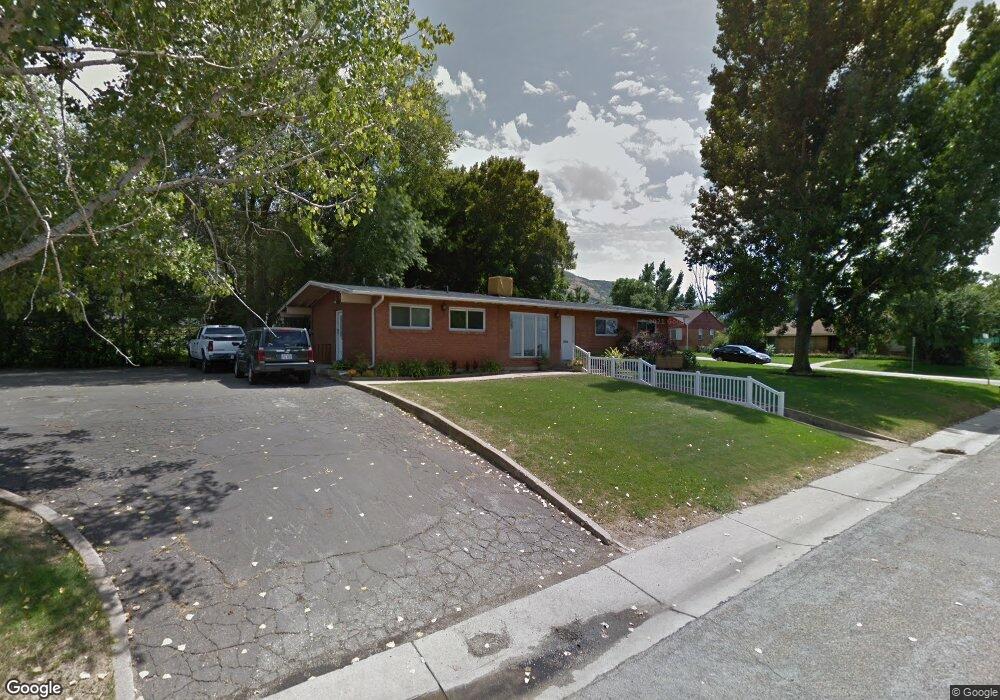
3046 Van Buren Ave Ogden, UT 84403
TO Smith NeighborhoodEstimated Value: $392,000 - $418,000
4
Beds
2
Baths
1,552
Sq Ft
$261/Sq Ft
Est. Value
About This Home
This home is located at 3046 Van Buren Ave, Ogden, UT 84403 and is currently estimated at $404,315, approximately $260 per square foot. 3046 Van Buren Ave is a home located in Weber County with nearby schools including Wasatch Elementary School, Mount Ogden Junior High School, and Ogden High School.
Ownership History
Date
Name
Owned For
Owner Type
Purchase Details
Closed on
Jun 13, 2023
Sold by
Thomson Michael F
Bought by
Chadbourne Christopher and Chadbourne Alex
Current Estimated Value
Home Financials for this Owner
Home Financials are based on the most recent Mortgage that was taken out on this home.
Original Mortgage
$17,028
Outstanding Balance
$16,573
Interest Rate
6.39%
Estimated Equity
$387,742
Purchase Details
Closed on
Jun 12, 2023
Sold by
K & J Realty Llc
Bought by
Chadbourne Christopher and Chadbourne Alex
Home Financials for this Owner
Home Financials are based on the most recent Mortgage that was taken out on this home.
Original Mortgage
$17,028
Outstanding Balance
$16,573
Interest Rate
6.39%
Estimated Equity
$387,742
Purchase Details
Closed on
Jan 17, 2020
Sold by
Club View Llc
Bought by
K & J Realty Llc
Purchase Details
Closed on
Jul 28, 2008
Sold by
Arthur D Peterson Trust and Peterson John D
Bought by
Club View Llc
Purchase Details
Closed on
Aug 23, 2000
Sold by
Peterson Arthur Dan and Peterson Sue V
Bought by
Peterson Arthur Daniel
Create a Home Valuation Report for This Property
The Home Valuation Report is an in-depth analysis detailing your home's value as well as a comparison with similar homes in the area
Home Values in the Area
Average Home Value in this Area
Purchase History
| Date | Buyer | Sale Price | Title Company |
|---|---|---|---|
| Chadbourne Christopher | -- | None Listed On Document | |
| Chadbourne Christopher | -- | Land Title | |
| K & J Realty Llc | -- | None Available | |
| Club View Llc | -- | None Available | |
| Peterson Arthur Daniel | -- | -- |
Source: Public Records
Mortgage History
| Date | Status | Borrower | Loan Amount |
|---|---|---|---|
| Open | Chadbourne Christopher | $17,028 | |
| Closed | Chadbourne Christopher | $17,028 | |
| Open | Chadbourne Christopher | $372,135 | |
| Closed | Chadbourne Christopher | $372,135 |
Source: Public Records
Tax History Compared to Growth
Tax History
| Year | Tax Paid | Tax Assessment Tax Assessment Total Assessment is a certain percentage of the fair market value that is determined by local assessors to be the total taxable value of land and additions on the property. | Land | Improvement |
|---|---|---|---|---|
| 2025 | $3,087 | $403,896 | $111,243 | $292,653 |
| 2024 | $3,087 | $216,699 | $61,183 | $155,516 |
| 2023 | $2,979 | $211,750 | $58,063 | $153,687 |
| 2022 | $3,822 | $282,000 | $86,728 | $195,272 |
| 2021 | $3,632 | $244,000 | $72,273 | $171,727 |
| 2020 | $3,723 | $232,000 | $57,819 | $174,181 |
| 2019 | $2,999 | $172,000 | $46,255 | $125,745 |
| 2018 | $2,882 | $164,000 | $46,255 | $117,745 |
| 2017 | $2,935 | $156,363 | $46,255 | $110,108 |
| 2016 | $2,815 | $147,112 | $37,004 | $110,108 |
| 2015 | $2,743 | $139,909 | $37,004 | $102,905 |
| 2014 | $2,917 | $147,808 | $37,004 | $110,804 |
Source: Public Records
Map
Nearby Homes
- 3035 Brinker Ave
- 1099 Healy St
- 3026 Harrison Blvd
- 3065 Iowa Ave
- 979 Patterson St
- 1060 Sullivan Dr
- 2839 S Van Buren Ave Unit 8
- 3119 S Van Buren Ave
- 2342 S Van Buren Ave
- 947 Patterson St
- 1161 29th St
- 3150 Iowa Ave
- 931 30th St
- 915 Patterson St
- 3248 S Van Buren Ave
- 1289 30th St
- 1289 31st St
- 917 Sullivan Dr
- 3173 Tyler Ave
- 3071 Quincy Ave
- 1112 Patterson St
- 1122 Patterson St
- 1130 Patterson St
- 1101 30th St
- 1105 Patterson St
- 3015 Van Buren Ave
- 3023 Van Buren Ave
- 1117 30th St
- 1115 Patterson St
- 1123 30th St
- 1127 Patterson St
- 1085 Patterson St
- 1084 Patterson St
- 1131 30th St
- 1085 30th St
- 3068 Van Buren Ave
- 1075 30th St
- 3003 Brinker Ave
- 1070 Patterson St
- 1137 Patterson St