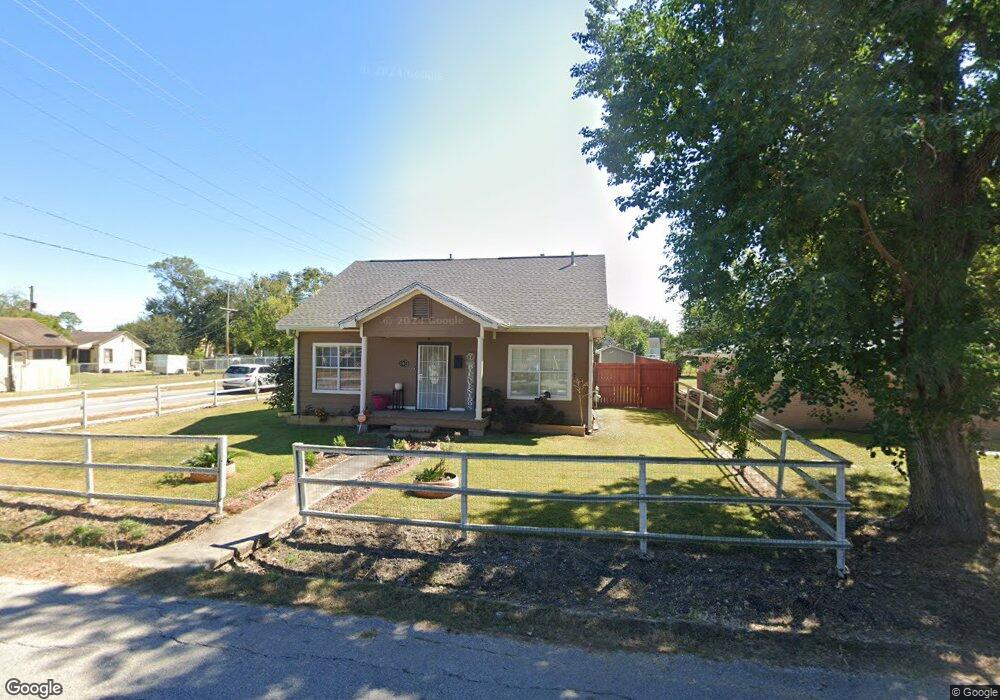
3048 18th St Port Arthur, TX 77642
Estimated Value: $148,000 - $196,339
3
Beds
3
Baths
2,712
Sq Ft
$67/Sq Ft
Est. Value
About This Home
This home is located at 3048 18th St, Port Arthur, TX 77642 and is currently estimated at $180,585, approximately $66 per square foot. 3048 18th St is a home located in Jefferson County with nearby schools including DeQueen Elementary School, Abraham Lincoln Middle School, and Memorial High School.
Ownership History
Date
Name
Owned For
Owner Type
Purchase Details
Closed on
Aug 28, 2019
Sold by
Wallace Ronnie
Bought by
Torres Jose L and Torres Maria L
Current Estimated Value
Home Financials for this Owner
Home Financials are based on the most recent Mortgage that was taken out on this home.
Original Mortgage
$104,500
Outstanding Balance
$91,906
Interest Rate
3.8%
Mortgage Type
New Conventional
Estimated Equity
$88,679
Purchase Details
Closed on
Mar 31, 2003
Sold by
Najera Ruben
Bought by
Wallace Ronnie
Create a Home Valuation Report for This Property
The Home Valuation Report is an in-depth analysis detailing your home's value as well as a comparison with similar homes in the area
Home Values in the Area
Average Home Value in this Area
Purchase History
| Date | Buyer | Sale Price | Title Company |
|---|---|---|---|
| Torres Jose L | -- | None Available | |
| Wallace Ronnie | -- | -- |
Source: Public Records
Mortgage History
| Date | Status | Borrower | Loan Amount |
|---|---|---|---|
| Open | Torres Jose L | $104,500 |
Source: Public Records
Tax History Compared to Growth
Tax History
| Year | Tax Paid | Tax Assessment Tax Assessment Total Assessment is a certain percentage of the fair market value that is determined by local assessors to be the total taxable value of land and additions on the property. | Land | Improvement |
|---|---|---|---|---|
| 2025 | $2,915 | $166,814 | -- | -- |
| 2024 | $2,915 | $159,260 | -- | -- |
| 2023 | $2,915 | $149,574 | $0 | $0 |
| 2022 | $3,584 | $112,862 | $0 | $0 |
| 2021 | $3,372 | $101,756 | $1,078 | $100,678 |
| 2020 | $2,748 | $103,087 | $1,078 | $102,009 |
| 2019 | $1,505 | $39,620 | $1,080 | $38,540 |
| 2018 | $1,505 | $47,230 | $1,080 | $46,150 |
| 2017 | $1,464 | $47,230 | $1,080 | $46,150 |
| 2016 | $1,384 | $47,230 | $1,080 | $46,150 |
| 2015 | $1,053 | $47,230 | $1,080 | $46,150 |
| 2014 | $1,053 | $47,230 | $1,080 | $46,150 |
Source: Public Records
Map
Nearby Homes