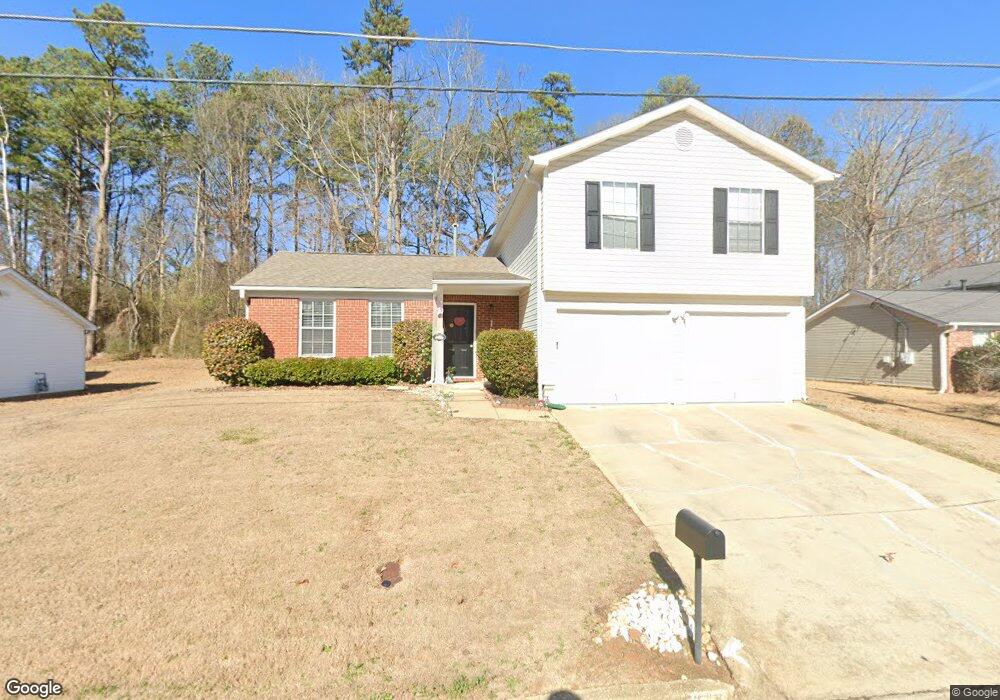
3048 Aberdeen Way Lithonia, GA 30038
Estimated Value: $234,000 - $339,000
3
Beds
3
Baths
1,688
Sq Ft
$166/Sq Ft
Est. Value
About This Home
This home is located at 3048 Aberdeen Way, Lithonia, GA 30038 and is currently estimated at $279,791, approximately $165 per square foot. 3048 Aberdeen Way is a home located in DeKalb County with nearby schools including Flat Rock Elementary School, Salem Middle School, and Martin Luther King- Jr. High School.
Ownership History
Date
Name
Owned For
Owner Type
Purchase Details
Closed on
Oct 5, 2022
Sold by
Vm Pronto Llc
Bought by
Sram Pack I C Llc
Current Estimated Value
Purchase Details
Closed on
Dec 16, 2021
Sold by
Ashley Nandi
Bought by
Offerpad Spe Borrower A Llc
Purchase Details
Closed on
Apr 30, 2004
Sold by
Hud
Bought by
Ashley Nandi and Ashley Tracy
Home Financials for this Owner
Home Financials are based on the most recent Mortgage that was taken out on this home.
Original Mortgage
$122,220
Interest Rate
5.36%
Mortgage Type
New Conventional
Purchase Details
Closed on
Jan 6, 2004
Sold by
Chase Manhattan Mtg Corp
Bought by
Hud
Purchase Details
Closed on
Jun 12, 1997
Sold by
Bonner Builders Inc
Bought by
Young Kurt B and Young Arna W
Home Financials for this Owner
Home Financials are based on the most recent Mortgage that was taken out on this home.
Original Mortgage
$96,580
Interest Rate
7.93%
Mortgage Type
FHA
Create a Home Valuation Report for This Property
The Home Valuation Report is an in-depth analysis detailing your home's value as well as a comparison with similar homes in the area
Home Values in the Area
Average Home Value in this Area
Purchase History
| Date | Buyer | Sale Price | Title Company |
|---|---|---|---|
| Sram Pack I C Llc | $318,936 | -- | |
| Offerpad Spe Borrower A Llc | $218,500 | -- | |
| Ashley Nandi | -- | -- | |
| Hud | -- | -- | |
| Chase Manhatan Mtg Corp | $112,656 | -- | |
| Young Kurt B | $96,500 | -- |
Source: Public Records
Mortgage History
| Date | Status | Borrower | Loan Amount |
|---|---|---|---|
| Previous Owner | Ashley Nandi | $122,220 | |
| Previous Owner | Young Kurt B | $96,580 |
Source: Public Records
Tax History Compared to Growth
Tax History
| Year | Tax Paid | Tax Assessment Tax Assessment Total Assessment is a certain percentage of the fair market value that is determined by local assessors to be the total taxable value of land and additions on the property. | Land | Improvement |
|---|---|---|---|---|
| 2025 | $4,925 | $100,000 | $19,000 | $81,000 |
| 2024 | $5,095 | $104,560 | $20,000 | $84,560 |
| 2023 | $5,095 | $86,800 | $4,520 | $82,280 |
| 2022 | $3,785 | $78,320 | $4,520 | $73,800 |
| 2021 | $2,024 | $61,040 | $4,520 | $56,520 |
| 2020 | $1,772 | $54,080 | $4,520 | $49,560 |
| 2019 | $1,752 | $52,840 | $4,520 | $48,320 |
| 2018 | $1,332 | $43,880 | $4,520 | $39,360 |
| 2017 | $1,356 | $40,000 | $4,520 | $35,480 |
| 2016 | $1,258 | $38,080 | $4,520 | $33,560 |
| 2014 | $653 | $20,360 | $4,480 | $15,880 |
Source: Public Records
Map
Nearby Homes
- 5614 Regency Forest Ct
- 5585 Fairington Place
- 3027 Fair Creek Ct
- 2700 Norfair Loop
- 3026 Highland Park Ln Unit II
- 2892 Norfair Loop
- 5556 Claridge Cir Unit 1
- 3287 Pennington Dr
- 5919 Cassie Dr
- 2878 Norfair Loop
- 3015 Bonnes Dr
- 5891 Cassie Dr
- 3304 Fairington Village Dr
- 3204 Fairington Village Dr
- 3102 Fairington Village Dr
- 5873 Taka Ln
- 3203 Fairington Ridge Cir
- 3255 Hunters Crossing Point
- 11203 Fairington Ridge Cir
- 5843 Taka Ln
- 3048 Aberdeen Way
- 3042 Aberdeen Way Unit 1532
- 3042 Aberdeen Way
- 3054 Aberdeen Way
- 3054 Aberdeen Way
- 3054 Aberdeen Way Unit 899
- 3036 Aberdeen Way Unit 3
- 3041 Aberdeen Way Unit 1
- 3041 Aberdeen Way Unit 3
- 3060 Aberdeen Way
- 3060 Aberdeen Way Unit III
- 5672 Bradley Cir
- 5674 Bradley Cir
- 3053 Aberdeen Way
- 3047 Aberdeen Way
- 3030 Aberdeen Way
- 3037 Aberdeen Way Unit 3
- 5668 Bradley Cir
- 3061 Aberdeen Way
- 3066 Aberdeen Way