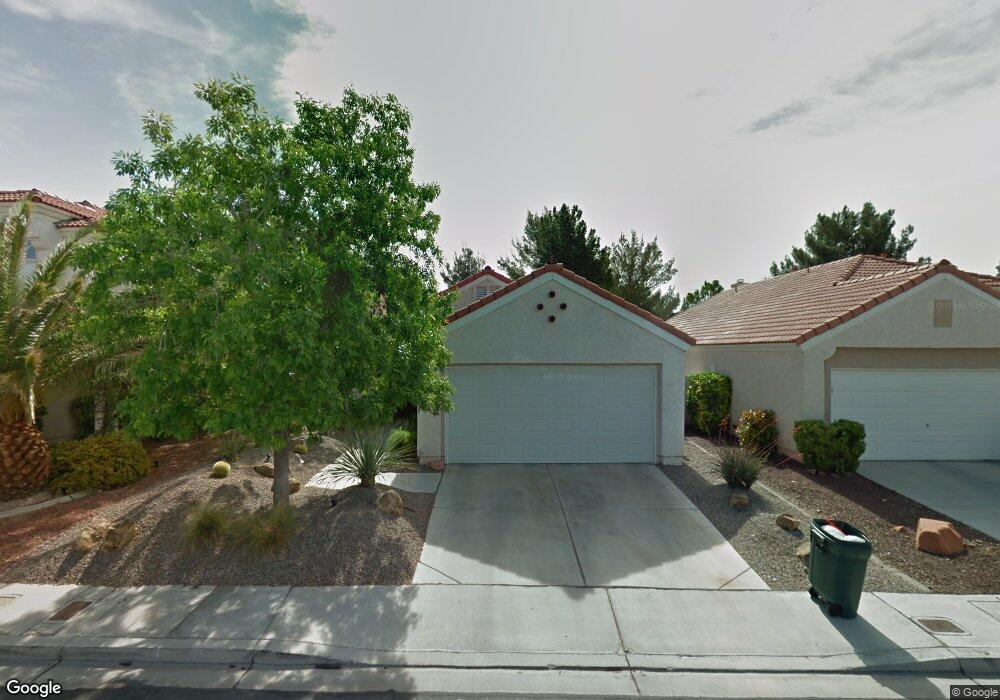
3048 Forest Lake St Las Vegas, NV 89117
The Section Seven NeighborhoodEstimated Value: $403,785 - $445,000
2
Beds
2
Baths
1,259
Sq Ft
$337/Sq Ft
Est. Value
About This Home
This home is located at 3048 Forest Lake St, Las Vegas, NV 89117 and is currently estimated at $424,446, approximately $337 per square foot. 3048 Forest Lake St is a home located in Clark County with nearby schools including M J Christensen Elementary School, Clifford J Lawrence Junior High School, and Bonanza High School.
Ownership History
Date
Name
Owned For
Owner Type
Purchase Details
Closed on
Jan 6, 2012
Sold by
Nelson Louise
Bought by
Wing Lila E
Current Estimated Value
Home Financials for this Owner
Home Financials are based on the most recent Mortgage that was taken out on this home.
Original Mortgage
$115,000
Outstanding Balance
$78,001
Interest Rate
3.91%
Mortgage Type
VA
Estimated Equity
$346,445
Purchase Details
Closed on
Mar 22, 2005
Sold by
Stueve Carol
Bought by
Nelson Louise
Home Financials for this Owner
Home Financials are based on the most recent Mortgage that was taken out on this home.
Original Mortgage
$172,000
Interest Rate
5.84%
Mortgage Type
Fannie Mae Freddie Mac
Purchase Details
Closed on
Mar 26, 1996
Sold by
Stueve Vincent and Stueve Carol J
Bought by
Stueve Vincent and Stueve Carol J
Purchase Details
Closed on
Jan 4, 1996
Sold by
Stueve Vincent and Stueve Carol J
Bought by
Stueve Vincent A and Stueve Carol
Create a Home Valuation Report for This Property
The Home Valuation Report is an in-depth analysis detailing your home's value as well as a comparison with similar homes in the area
Home Values in the Area
Average Home Value in this Area
Purchase History
| Date | Buyer | Sale Price | Title Company |
|---|---|---|---|
| Wing Lila E | $115,000 | Lawyers Title Of Nevada Cha | |
| Nelson Louise | $265,000 | First Amer Title Co Of Nv | |
| Stueve Vincent | -- | Land Title | |
| Stueve Vincent A | -- | -- |
Source: Public Records
Mortgage History
| Date | Status | Borrower | Loan Amount |
|---|---|---|---|
| Open | Wing Lila E | $115,000 | |
| Previous Owner | Nelson Louise | $172,000 |
Source: Public Records
Tax History Compared to Growth
Tax History
| Year | Tax Paid | Tax Assessment Tax Assessment Total Assessment is a certain percentage of the fair market value that is determined by local assessors to be the total taxable value of land and additions on the property. | Land | Improvement |
|---|---|---|---|---|
| 2025 | $693 | $80,052 | $36,575 | $43,477 |
| 2024 | $642 | $80,052 | $36,575 | $43,477 |
| 2023 | $642 | $73,676 | $31,920 | $41,756 |
| 2022 | $840 | $66,517 | $27,930 | $38,587 |
| 2021 | $903 | $60,530 | $23,608 | $36,922 |
| 2020 | $860 | $60,465 | $23,608 | $36,857 |
| 2019 | $848 | $57,811 | $21,280 | $36,531 |
| 2018 | $739 | $52,567 | $17,010 | $35,557 |
| 2017 | $1,056 | $52,992 | $16,695 | $36,297 |
| 2016 | $760 | $49,513 | $12,915 | $36,598 |
| 2015 | $789 | $41,516 | $11,025 | $30,491 |
| 2014 | $929 | $39,628 | $7,875 | $31,753 |
Source: Public Records
Map
Nearby Homes
- 3044 Forest Lake St
- 9624 Beach Water Cir
- 9717 Sierra Mesa Ave
- 9605 Blowing Sand Cir
- 9713 Cascade Falls Ave
- 9548 Wooden Pier Way
- 3001 Bridge Creek St
- 3213 Shallow Point Cir
- 9504 Cliff View Way
- 9708 Blazing Star Ct
- 9833 Dardanelle Ct
- 9820 Cross Creek Way
- 3009 Periscope Ct
- 9429 Abalone Way
- 9741 Horizon Hills Dr
- 2821 Willow Wind Ct
- 2909 Ivory Reef Ct
- 2728 Monrovia Dr
- 9544 Lazy River Dr
- 2729 Beachside Ct
- 3052 Forest Lake St
- 3040 Forest Lake St
- 3036 Forest Lake St
- 9700 Sierra Mesa Ave
- 9701 Sierra Mesa Ave
- 9621 Blowing Sand Cir
- 3100 Forest Lake St
- 9628 Beach Water Cir
- 9704 Sierra Mesa Ave
- 9705 Sierra Mesa Ave
- 3104 Forest Lake St
- 9617 Blowing Sand Cir
- 3033 Forest Lake St
- 9704 Peacock Hill Cir
- 9708 Sierra Mesa Ave Unit none
- 9708 Sierra Mesa Ave
- 3028 Forest Lake St
- 9624 Beach Water Cir Unit None
- 9709 Sierra Mesa Ave
- 9709 Sierra Mesa Ave Unit n/a