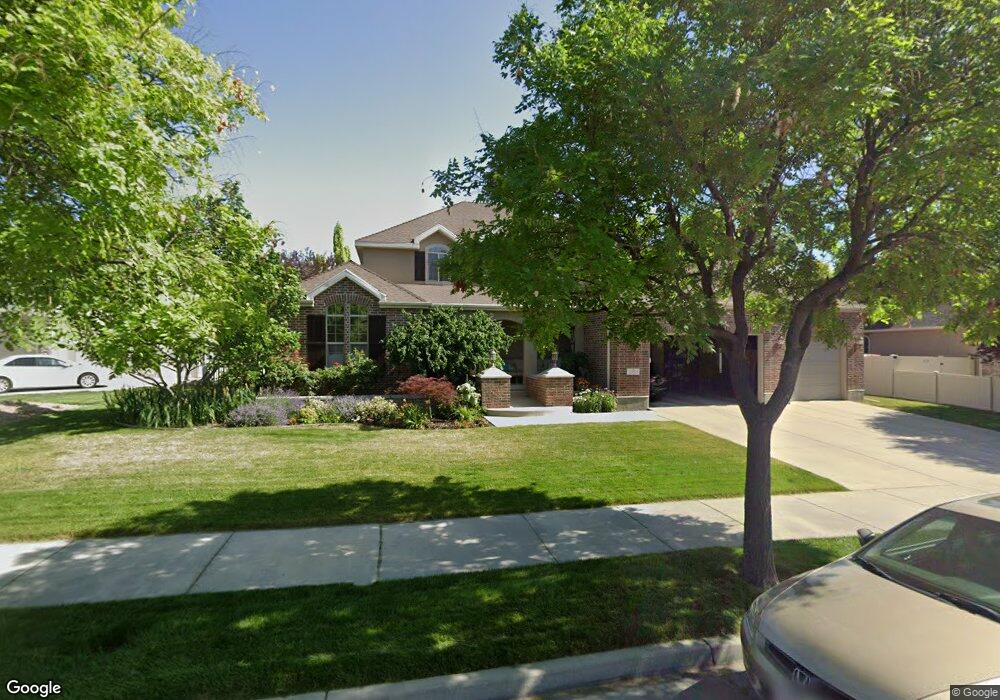
3048 Harper Peak Ct South Jordan, UT 84095
Estimated Value: $943,000 - $989,000
4
Beds
3
Baths
2,958
Sq Ft
$330/Sq Ft
Est. Value
About This Home
This home is located at 3048 Harper Peak Ct, South Jordan, UT 84095 and is currently estimated at $975,879, approximately $329 per square foot. 3048 Harper Peak Ct is a home located in Salt Lake County with nearby schools including Monte Vista Elementary School, South Jordan Middle School, and Mountain West Montessori Academy.
Ownership History
Date
Name
Owned For
Owner Type
Purchase Details
Closed on
Aug 14, 2020
Sold by
Bean Kristina and Bean Michael C
Bought by
Bean Kristina M and Bean Michael C
Current Estimated Value
Home Financials for this Owner
Home Financials are based on the most recent Mortgage that was taken out on this home.
Original Mortgage
$255,000
Outstanding Balance
$203,885
Interest Rate
3%
Mortgage Type
New Conventional
Estimated Equity
$771,994
Purchase Details
Closed on
Dec 5, 2008
Sold by
Bean Michael C and Bean Kristina M
Bought by
Bean Kristina and Bean Michael C
Home Financials for this Owner
Home Financials are based on the most recent Mortgage that was taken out on this home.
Original Mortgage
$231,000
Interest Rate
6.47%
Mortgage Type
New Conventional
Purchase Details
Closed on
Aug 20, 2004
Sold by
Ivory Homes Ltd
Bought by
Bean Michael C and Bean Kristina M
Home Financials for this Owner
Home Financials are based on the most recent Mortgage that was taken out on this home.
Original Mortgage
$240,000
Interest Rate
4.75%
Mortgage Type
New Conventional
Create a Home Valuation Report for This Property
The Home Valuation Report is an in-depth analysis detailing your home's value as well as a comparison with similar homes in the area
Home Values in the Area
Average Home Value in this Area
Purchase History
| Date | Buyer | Sale Price | Title Company |
|---|---|---|---|
| Bean Kristina M | -- | Meridian Title | |
| Bean Kristina | -- | Monument Title Ins Co | |
| Bean Michael C | -- | Cottonwood Title Ins Agency |
Source: Public Records
Mortgage History
| Date | Status | Borrower | Loan Amount |
|---|---|---|---|
| Open | Bean Kristina M | $255,000 | |
| Closed | Bean Kristina | $231,000 | |
| Closed | Bean Michael C | $240,000 |
Source: Public Records
Tax History Compared to Growth
Tax History
| Year | Tax Paid | Tax Assessment Tax Assessment Total Assessment is a certain percentage of the fair market value that is determined by local assessors to be the total taxable value of land and additions on the property. | Land | Improvement |
|---|---|---|---|---|
| 2025 | $4,597 | $921,900 | $255,600 | $666,300 |
| 2024 | $4,597 | $872,800 | $243,500 | $629,300 |
| 2023 | $4,583 | $821,100 | $236,400 | $584,700 |
| 2022 | $4,691 | $823,700 | $231,800 | $591,900 |
| 2021 | $3,780 | $608,900 | $191,600 | $417,300 |
| 2020 | $3,686 | $556,600 | $191,600 | $365,000 |
| 2019 | $3,581 | $531,500 | $181,300 | $350,200 |
| 2018 | $3,396 | $501,600 | $180,300 | $321,300 |
| 2017 | $3,331 | $482,200 | $177,200 | $305,000 |
| 2016 | $3,459 | $474,400 | $163,800 | $310,600 |
| 2015 | $3,339 | $445,300 | $165,300 | $280,000 |
| 2014 | $3,685 | $482,900 | $157,600 | $325,300 |
Source: Public Records
Map
Nearby Homes
- 3028 W Wilkins Peak Ct
- 2817 W 11460 St S Unit 203
- 3312 W Country Bluff Rd
- 3407 W Pazos Cir Unit 4
- 2732 W Lizzi Cove
- 11159 Via Encantada Way
- 2834 Proudest Ln Unit 247
- 11513 S Jackson Downs Way
- 3371 W Waterbridge Cove Unit 417
- 3168 Chalk Creek Way
- 3550 W Franco Court #2
- 2602 W 11625 S
- 2626 W Midas Side Way
- 3376 W Water Crescent Place
- 3558 W Via Bello Ct
- 3537 W Sojo Dr
- 10868 Reta View Ct Unit 232
- 2410 W 11400 S
- 11716 S 2610 W
- 10827 S Logan Canyon Rd
- 3032 Harper Peak Ct
- 3068 Harper Peak Ct
- 3068 W Harper Peak Ct
- 3045 Wilkins Peak Ct
- 3029 Wilkins Peak Ct
- 3057 Harper Peak Ct
- 3057 W Harper Peak Ct
- 3037 Harper Peak Ct
- 3037 W Harper Peak Ct
- 3082 W Harper Peak Ct
- 3082 Harper Peak Ct
- 3009 Wilkins Peak Ct
- 3073 Harper Peak Ct
- 3049 W Wilkins Peak Ct
- 3049 Wilkins Peak Ct
- 3083 W Harper Peak Ct
- 3083 Harper Peak Ct
- 11358 Alta Peak Rd
- 11337 Alta Peak Rd
- 3042 Uintah Pines Cir