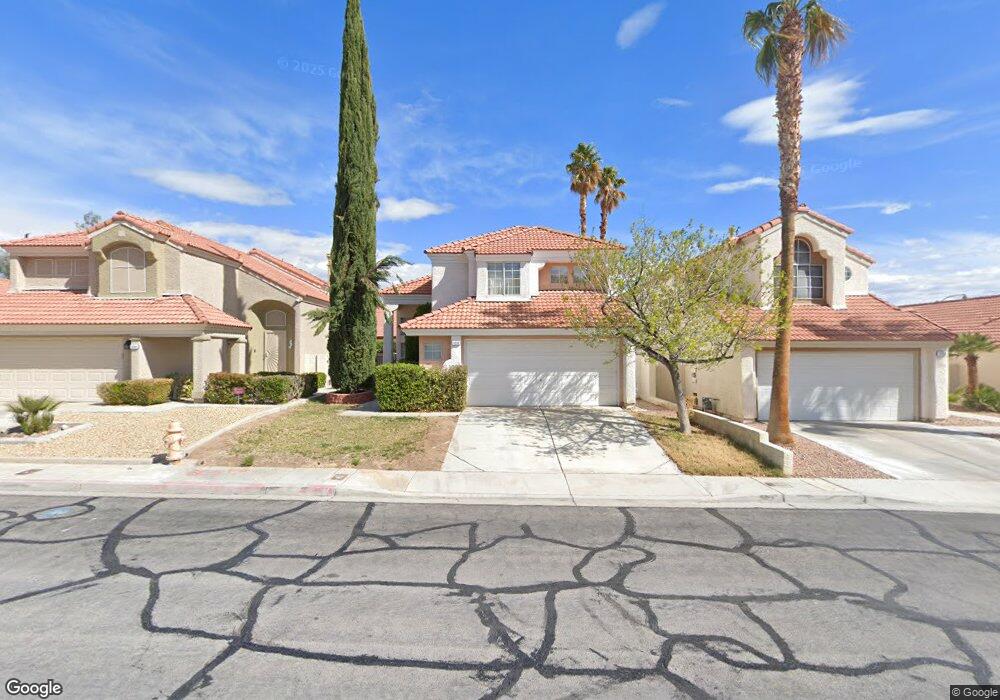
3048 Reef View St Las Vegas, NV 89117
The Section Seven NeighborhoodEstimated Value: $439,000 - $489,000
3
Beds
3
Baths
1,710
Sq Ft
$273/Sq Ft
Est. Value
About This Home
This home is located at 3048 Reef View St, Las Vegas, NV 89117 and is currently estimated at $467,120, approximately $273 per square foot. 3048 Reef View St is a home located in Clark County with nearby schools including M J Christensen Elementary School, Clifford J Lawrence Junior High School, and Bonanza High School.
Ownership History
Date
Name
Owned For
Owner Type
Purchase Details
Closed on
Dec 17, 2002
Sold by
Bittinger Cathy and Geringer Robert D
Bought by
Hendrix Clarence
Current Estimated Value
Home Financials for this Owner
Home Financials are based on the most recent Mortgage that was taken out on this home.
Original Mortgage
$165,000
Interest Rate
5.86%
Mortgage Type
Balloon
Purchase Details
Closed on
Jul 17, 2001
Sold by
7 & 13 Cathy Bittinger Inc
Bought by
Bittinger Cathy
Purchase Details
Closed on
Feb 7, 2001
Sold by
Schweit Phillip A and Schweit Pamela S
Bought by
Schweit Phillip and Schweit Pamela
Purchase Details
Closed on
Feb 14, 1996
Sold by
Seven Thirteen Inc
Bought by
Bittinger Cathy
Purchase Details
Closed on
Jan 22, 1996
Sold by
Bittinger Cathy
Bought by
Seven Thirteen Inc
Create a Home Valuation Report for This Property
The Home Valuation Report is an in-depth analysis detailing your home's value as well as a comparison with similar homes in the area
Home Values in the Area
Average Home Value in this Area
Purchase History
| Date | Buyer | Sale Price | Title Company |
|---|---|---|---|
| Hendrix Clarence | $165,000 | First American Title Co | |
| Geringer Robert D | $165,000 | First American Title Co | |
| Bittinger Cathy | $139,000 | First American Title Co | |
| Schweit Phillip | -- | -- | |
| Bittinger Cathy | $9,500 | Old Republic Title Company | |
| Seven Thirteen Inc | -- | -- |
Source: Public Records
Mortgage History
| Date | Status | Borrower | Loan Amount |
|---|---|---|---|
| Closed | Hendrix Clarence | $165,000 |
Source: Public Records
Tax History Compared to Growth
Tax History
| Year | Tax Paid | Tax Assessment Tax Assessment Total Assessment is a certain percentage of the fair market value that is determined by local assessors to be the total taxable value of land and additions on the property. | Land | Improvement |
|---|---|---|---|---|
| 2025 | $1,934 | $85,254 | $36,575 | $48,679 |
| 2024 | $1,878 | $85,254 | $36,575 | $48,679 |
| 2023 | $1,878 | $78,719 | $31,920 | $46,799 |
| 2022 | $1,823 | $71,253 | $27,930 | $43,323 |
| 2021 | $1,770 | $65,183 | $23,608 | $41,575 |
| 2020 | $1,716 | $65,131 | $23,608 | $41,523 |
| 2019 | $1,695 | $62,417 | $21,280 | $41,137 |
| 2018 | $1,617 | $56,792 | $17,010 | $39,782 |
| 2017 | $1,880 | $57,336 | $16,695 | $40,641 |
| 2016 | $1,515 | $53,911 | $12,915 | $40,996 |
| 2015 | $1,511 | $45,197 | $11,025 | $34,172 |
| 2014 | $1,467 | $43,401 | $7,875 | $35,526 |
Source: Public Records
Map
Nearby Homes
- 9717 Sierra Mesa Ave
- 3001 Bridge Creek St
- 9724 Cascade Falls Ave
- 9713 Cascade Falls Ave
- 2909 Ivory Reef Ct
- 9833 Dardanelle Ct
- 9624 Beach Water Cir
- 2821 Willow Wind Ct
- 9605 Blowing Sand Cir
- 10025 Harpoon Cir
- 10028 Sail Landing Ct
- 9820 Cross Creek Way
- 3026 Cherum St
- 9708 Blazing Star Ct
- 10024 Rolling Glen Ct
- 9548 Wooden Pier Way
- 9917 Aspen Knoll Ct
- 10191 Refuge Ct Unit 2
- 3213 Shallow Point Cir
- 9905 Fox Springs Dr
- 3044 Reef View St
- 3052 Reef View St
- 3040 Reef View St
- 3056 Reef View St Unit none
- 3056 Reef View St
- 9829 Virginia Woods Cir
- 3108 Biscayne Springs Ln
- 9825 Virginia Woods Cir
- 3036 Reef View St
- 3112 Biscayne Springs Ln
- 3049 Reef View St
- 3045 Reef View St
- 3053 Reef View St
- 9821 Virginia Woods Cir
- 3116 Biscayne Springs Ln
- 3057 Reef View St
- 3037 Reef View St
- 9817 Virginia Woods Cir
- 3109 Biscayne Springs Ln