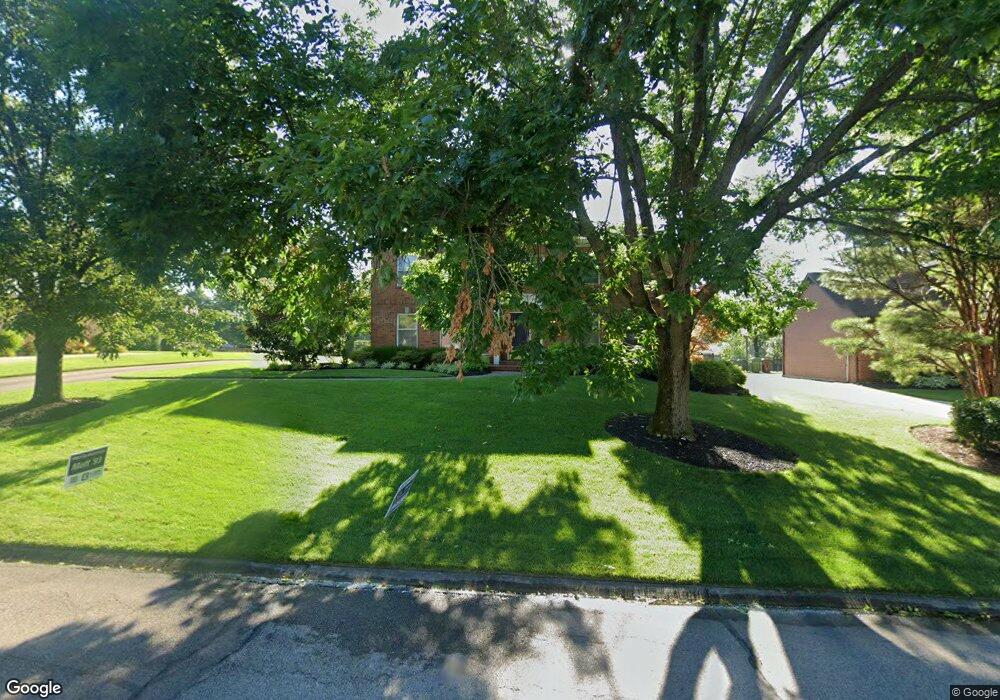
3048 Southfork Dr Cincinnati, OH 45248
Estimated Value: $562,258 - $721,000
4
Beds
3
Baths
3,796
Sq Ft
$168/Sq Ft
Est. Value
About This Home
This home is located at 3048 Southfork Dr, Cincinnati, OH 45248 and is currently estimated at $638,065, approximately $168 per square foot. 3048 Southfork Dr is a home located in Hamilton County with nearby schools including John Foster Dulles Elementary School, Rapid Run Middle School, and Oak Hills High School.
Ownership History
Date
Name
Owned For
Owner Type
Purchase Details
Closed on
Jul 5, 2007
Sold by
Vogelpohl Daniel D and Vogelpohl Isla
Bought by
Busam Matthew L and Peirick Busam Mollie E
Current Estimated Value
Home Financials for this Owner
Home Financials are based on the most recent Mortgage that was taken out on this home.
Original Mortgage
$303,750
Outstanding Balance
$186,657
Interest Rate
6.54%
Mortgage Type
Purchase Money Mortgage
Estimated Equity
$451,408
Purchase Details
Closed on
Aug 16, 2002
Sold by
Neville Urban G
Bought by
Vogelpohl Daniel D
Home Financials for this Owner
Home Financials are based on the most recent Mortgage that was taken out on this home.
Original Mortgage
$290,000
Interest Rate
6.63%
Create a Home Valuation Report for This Property
The Home Valuation Report is an in-depth analysis detailing your home's value as well as a comparison with similar homes in the area
Home Values in the Area
Average Home Value in this Area
Purchase History
| Date | Buyer | Sale Price | Title Company |
|---|---|---|---|
| Busam Matthew L | $405,000 | Advanced Land Title Agency | |
| Vogelpohl Daniel D | $391,800 | -- |
Source: Public Records
Mortgage History
| Date | Status | Borrower | Loan Amount |
|---|---|---|---|
| Open | Busam Matthew L | $303,750 | |
| Previous Owner | Vogelpohl Daniel D | $290,000 |
Source: Public Records
Tax History
| Year | Tax Paid | Tax Assessment Tax Assessment Total Assessment is a certain percentage of the fair market value that is determined by local assessors to be the total taxable value of land and additions on the property. | Land | Improvement |
|---|---|---|---|---|
| 2025 | $8,842 | $169,723 | $18,981 | $150,742 |
| 2024 | $8,636 | $169,723 | $18,981 | $150,742 |
| 2023 | $8,636 | $169,723 | $18,981 | $150,742 |
| 2022 | $7,710 | $128,475 | $16,986 | $111,489 |
| 2021 | $6,932 | $128,475 | $16,986 | $111,489 |
| 2020 | $7,012 | $128,475 | $16,986 | $111,489 |
| 2019 | $6,433 | $107,682 | $15,166 | $92,516 |
| 2018 | $6,442 | $107,682 | $15,166 | $92,516 |
| 2017 | $6,071 | $107,682 | $15,166 | $92,516 |
| 2016 | $6,214 | $110,086 | $15,579 | $94,507 |
| 2015 | $6,268 | $110,086 | $15,579 | $94,507 |
| 2014 | $6,277 | $110,086 | $15,579 | $94,507 |
| 2013 | $5,923 | $111,199 | $15,736 | $95,463 |
Source: Public Records
Map
Nearby Homes
- 3263 Bellacre Ct
- 3311 Starhaven Trail
- 3307 Glenmont Ln
- 6040 Countrymeadow Ln
- 3157 Westbourne Dr
- 5918 Leeside Trail
- 3323 Bellehaven Ct
- 6090 Muddy Creek Rd
- 5869 Weston Ct
- 5961 Lawrence Rd
- 5375 Werk Rd
- 2985 Welge Ln
- 3454 Eyrich Rd
- 3433 Tolland Ct
- 5584 Green Acres Ct
- 6233 Sharlene Dr
- 5647 N Glen Rd
- 2710 Carroll Ave
- 5749 Beech Grove Ln
- 5690 Candlelite Terrace
- 3056 Southfork Dr
- 3040 Southfork Dr
- 5720 Thomaridge Ct
- 3064 Southfork Dr
- 3032 Southfork Dr
- 5719 Thomaridge Ct
- 3049 Southfork Dr
- 3041 Southfork Dr
- 3057 Southfork Dr
- 3072 Southfork Dr
- 3024 Southfork Dr
- 3065 Southfork Dr
- 3033 Southfork Dr
- 5710 Thomaridge Ct
- 5755 Breezewood Dr
- 5763 Breezewood Dr
- 3073 Southfork Dr
- 3080 Southfork Dr
- 3025 Southfork Dr
- 3016 Southfork Dr
Your Personal Tour Guide
Ask me questions while you tour the home.