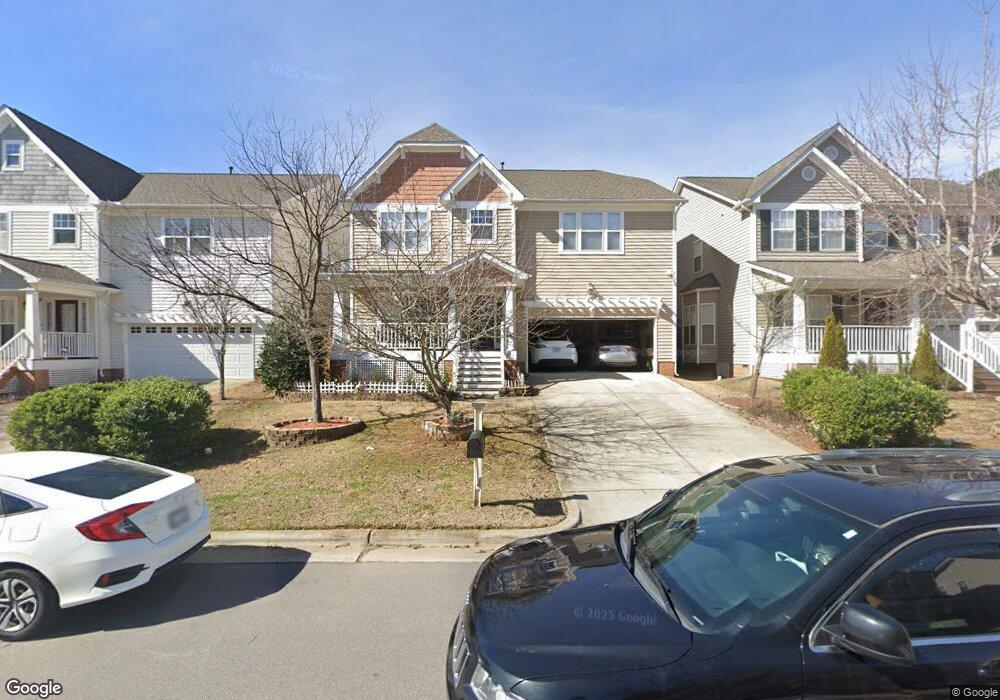
3049 Kilarney Ridge Loop Cary, NC 27511
South Cary NeighborhoodEstimated Value: $679,792 - $798,000
--
Bed
3
Baths
3,448
Sq Ft
$209/Sq Ft
Est. Value
About This Home
This home is located at 3049 Kilarney Ridge Loop, Cary, NC 27511 and is currently estimated at $719,698, approximately $208 per square foot. 3049 Kilarney Ridge Loop is a home located in Wake County with nearby schools including Laurel Park Elementary, Salem Middle, and Apex High School.
Ownership History
Date
Name
Owned For
Owner Type
Purchase Details
Closed on
Jan 23, 2012
Sold by
Joseph Binny and Binny Sussy
Bought by
Joseph Binny and Binny Sussy
Current Estimated Value
Home Financials for this Owner
Home Financials are based on the most recent Mortgage that was taken out on this home.
Original Mortgage
$236,000
Outstanding Balance
$25,900
Interest Rate
3.23%
Mortgage Type
New Conventional
Estimated Equity
$693,798
Purchase Details
Closed on
Nov 20, 2006
Sold by
K Hovnanian Homes Of North Carolina Inc
Bought by
Joseph Binny and Lype Sussy K
Home Financials for this Owner
Home Financials are based on the most recent Mortgage that was taken out on this home.
Original Mortgage
$300,400
Interest Rate
5.96%
Mortgage Type
Purchase Money Mortgage
Purchase Details
Closed on
Jun 5, 2006
Sold by
Laurel Island Partners Llc
Bought by
K Hovnanian Homes Of North Carolina Inc
Create a Home Valuation Report for This Property
The Home Valuation Report is an in-depth analysis detailing your home's value as well as a comparison with similar homes in the area
Home Values in the Area
Average Home Value in this Area
Purchase History
| Date | Buyer | Sale Price | Title Company |
|---|---|---|---|
| Joseph Binny | -- | None Available | |
| Joseph Binny | $334,000 | None Available | |
| K Hovnanian Homes Of North Carolina Inc | $672,000 | None Available |
Source: Public Records
Mortgage History
| Date | Status | Borrower | Loan Amount |
|---|---|---|---|
| Open | Joseph Binny | $236,000 | |
| Closed | Joseph Binny | $300,400 |
Source: Public Records
Tax History Compared to Growth
Tax History
| Year | Tax Paid | Tax Assessment Tax Assessment Total Assessment is a certain percentage of the fair market value that is determined by local assessors to be the total taxable value of land and additions on the property. | Land | Improvement |
|---|---|---|---|---|
| 2025 | $5,726 | $665,712 | $160,000 | $505,712 |
| 2024 | $5,602 | $665,712 | $160,000 | $505,712 |
| 2023 | $4,098 | $407,012 | $90,000 | $317,012 |
| 2022 | $3,946 | $407,012 | $90,000 | $317,012 |
| 2021 | $3,866 | $407,012 | $90,000 | $317,012 |
| 2020 | $3,887 | $407,012 | $90,000 | $317,012 |
| 2019 | $3,686 | $342,385 | $90,000 | $252,385 |
| 2018 | $3,459 | $342,385 | $90,000 | $252,385 |
| 2017 | $3,324 | $342,385 | $90,000 | $252,385 |
| 2016 | $3,274 | $342,385 | $90,000 | $252,385 |
| 2015 | $3,340 | $337,225 | $86,000 | $251,225 |
| 2014 | $3,149 | $337,225 | $86,000 | $251,225 |
Source: Public Records
Map
Nearby Homes
- 3040 Kilarney Ridge Loop
- 1016 Kilarney Ridge Loop
- 2120 Royal Berry Ct
- 114 Colchis Ct
- 215 Pointe Crest Ct
- 116 Lost Tree Ln
- 728 Blossom Bay Ln
- 101 Solway Ct
- 717 Sweet Laurel Ln
- 317 Arvo Ln
- 1710 Burnley Dr
- 308 Wax Myrtle Ct
- 112 Romaine Ct
- 532 Applecross Dr
- 209 Smokemont Dr
- 109 Gatepost Ln
- 414 Applecross Dr
- 802 New Derby Ln
- 126 Hidden Bluff Ln
- 1104 Suterland Rd
- 3053 Kilarney Ridge Loop
- 3045 Kilarney Ridge Loop
- 3043 Kilarney Ridge Loop
- 3048 Kilarney Ridge Loop
- 3050 Kilarney Ridge Loop
- 3046 Kilarney Ridge Loop
- 3052 Kilarney Ridge Loop
- 3012 Kilarney Ridge Loop
- 3014 Kilarney Ridge Loop
- 3010 Kilarney Ridge Loop
- 3054 Kilarney Ridge Loop
- 3016 Kilarney Ridge Loop
- 3044 Kilarney Ridge Loop
- 3041 Kilarney Ridge Loop
- 3006 Kilarney Ridge Loop
- 3004 Kilarney Ridge Loop
- 3008 Kilarney Ridge Loop
- 3002 Kilarney Ridge Loop
- 3018 Kilarney Ridge Loop
- 3042 Kilarney Ridge Loop