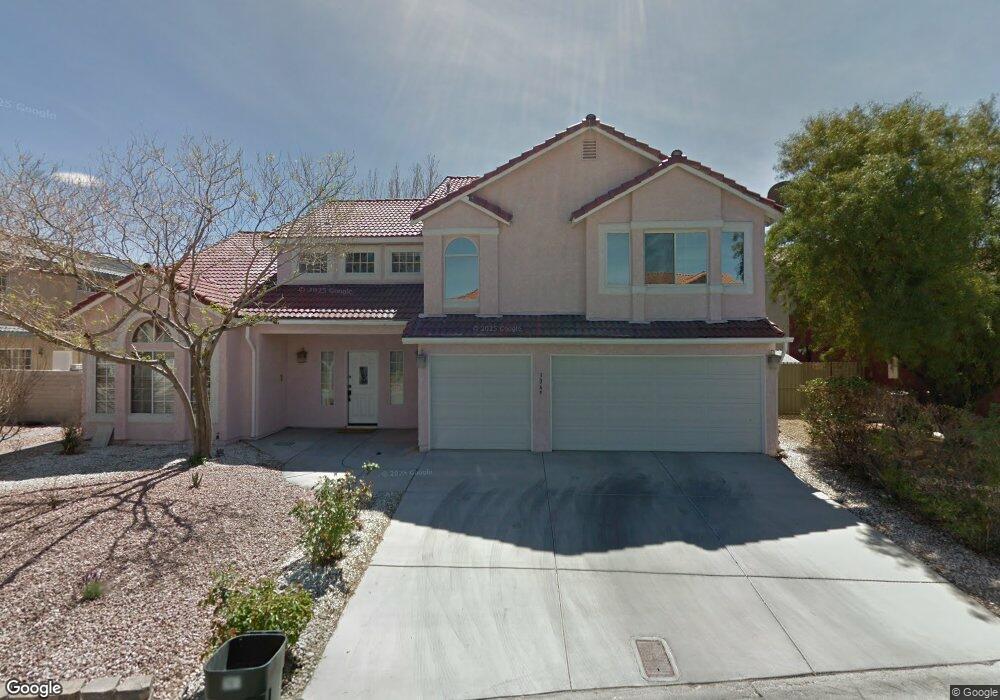
3049 Nordoff Cir Las Vegas, NV 89121
Paradise Valley East NeighborhoodEstimated Value: $346,000 - $802,000
3
Beds
3
Baths
3,431
Sq Ft
$174/Sq Ft
Est. Value
About This Home
This home is located at 3049 Nordoff Cir, Las Vegas, NV 89121 and is currently estimated at $597,122, approximately $174 per square foot. 3049 Nordoff Cir is a home located in Clark County with nearby schools including George E. Harris Elementary School, William E. Orr Middle School, and Valley High School.
Ownership History
Date
Name
Owned For
Owner Type
Purchase Details
Closed on
Aug 9, 2017
Sold by
Miller Heena and Naik Balvantrai
Bought by
Miller Heena
Current Estimated Value
Home Financials for this Owner
Home Financials are based on the most recent Mortgage that was taken out on this home.
Original Mortgage
$151,832
Outstanding Balance
$81,203
Interest Rate
3.96%
Mortgage Type
New Conventional
Estimated Equity
$515,919
Purchase Details
Closed on
Sep 7, 2010
Sold by
Wells Fargo Bank Na
Bought by
Miller Heena and Naik Balvantrai
Home Financials for this Owner
Home Financials are based on the most recent Mortgage that was taken out on this home.
Original Mortgage
$139,200
Interest Rate
4.26%
Mortgage Type
New Conventional
Purchase Details
Closed on
Jun 29, 2010
Sold by
Banks Andrea F Smith
Bought by
Wells Fargo Bank Na and Wachovia Mortgage Fsb
Create a Home Valuation Report for This Property
The Home Valuation Report is an in-depth analysis detailing your home's value as well as a comparison with similar homes in the area
Home Values in the Area
Average Home Value in this Area
Purchase History
| Date | Buyer | Sale Price | Title Company |
|---|---|---|---|
| Miller Heena | -- | Servicelink East Escrow | |
| Miller Heena | $174,000 | Noble Title | |
| Wells Fargo Bank Na | $180,000 | Fidelity National Default S |
Source: Public Records
Mortgage History
| Date | Status | Borrower | Loan Amount |
|---|---|---|---|
| Open | Miller Heena | $151,832 | |
| Previous Owner | Miller Heena | $139,200 |
Source: Public Records
Tax History Compared to Growth
Tax History
| Year | Tax Paid | Tax Assessment Tax Assessment Total Assessment is a certain percentage of the fair market value that is determined by local assessors to be the total taxable value of land and additions on the property. | Land | Improvement |
|---|---|---|---|---|
| 2025 | $1,482 | $124,614 | $42,700 | $81,914 |
| 2024 | $2,419 | $124,614 | $42,700 | $81,914 |
| 2023 | $1,190 | $122,568 | $43,365 | $79,203 |
| 2022 | $1,445 | $113,857 | $41,160 | $72,697 |
| 2021 | $1,318 | $100,979 | $31,238 | $69,741 |
| 2020 | $1,172 | $100,847 | $31,238 | $69,609 |
| 2019 | $1,890 | $98,894 | $29,768 | $69,126 |
| 2018 | $1,011 | $84,908 | $22,418 | $62,490 |
| 2017 | $2,353 | $80,241 | $20,580 | $59,661 |
| 2016 | $1,190 | $71,022 | $14,350 | $56,672 |
| 2015 | $1,685 | $55,619 | $14,350 | $41,269 |
| 2014 | $1,884 | $54,564 | $14,350 | $40,214 |
Source: Public Records
Map
Nearby Homes
- 3064 Carlotta Cir
- 3065 E Twain Ave
- 3073 Conquista Ct
- 3130 Espanol Dr
- 3131 E Katie Ave
- 3066 Conquista Ct
- 3860 Hildebrand Ln
- 3078 Conquista Ct
- 3074 Mirado Ct
- 2701 Laguna Shores Ln
- 2716 Laguna Shores Ln
- 3789 Gershon Ct
- 3637 Laguna Del Sol Dr
- 3840 Topaz St
- 3251 Southridge Ave
- 2755 E Asgard Ave
- 3555 Shelome Ct
- 2970 Galit Ave
- 2619 Regency Cove Ct
- 2635 Regency Cove Ct
- 3037 Nordoff Cir
- 3061 Nordoff Cir
- 3050 Nordoff Cir
- 3038 Nordoff Cir Unit n
- 3038 Nordoff Cir
- 3025 Nordoff Cir
- 3062 Nordoff Cir
- 3801 Robar St
- 3026 Nordoff Cir
- 3085 Nordoff Cir
- 3810 Robar St
- 3011 Nordoff Cir
- 3086 Nordoff Cir
- 3041 Carlotta Cir
- 3014 Nordoff Cir
- 3053 Carlotta Cir
- 3029 Carlotta Cir
- 3785 Hildebrand Ln
- 3825 Hildebrand Ln
- 3077 Carlotta Cir