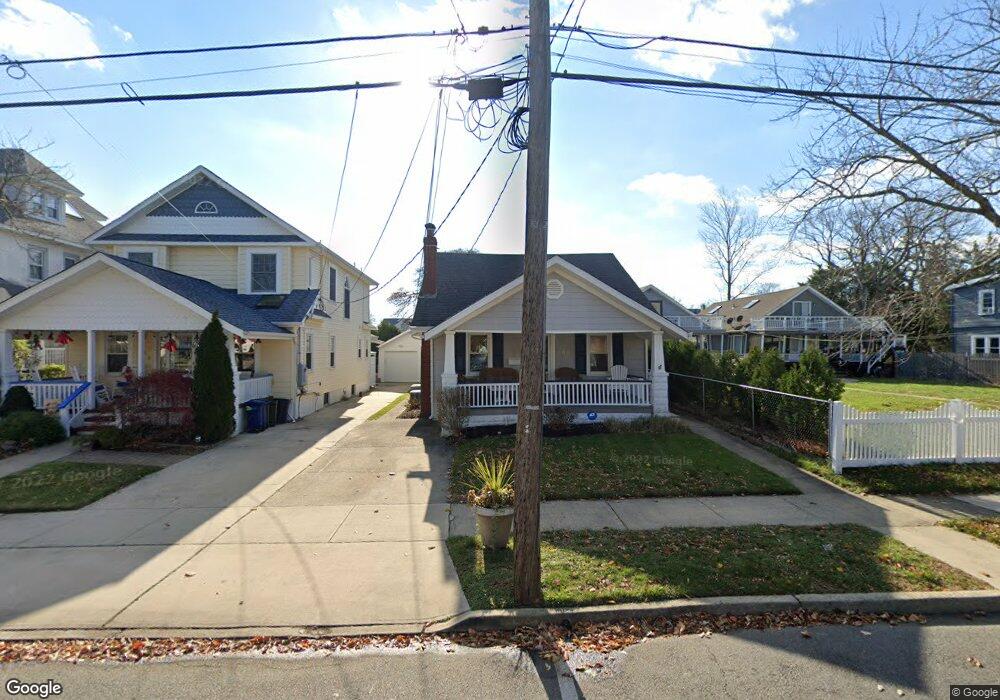
305 11th Ave Belmar, NJ 07719
Estimated Value: $1,055,455 - $1,320,000
3
Beds
2
Baths
1,825
Sq Ft
$658/Sq Ft
Est. Value
About This Home
This home is located at 305 11th Ave, Belmar, NJ 07719 and is currently estimated at $1,201,614, approximately $658 per square foot. 305 11th Ave is a home located in Monmouth County with nearby schools including Belmar Elementary School, St. Rose Grammar School, and St Rose High School.
Ownership History
Date
Name
Owned For
Owner Type
Purchase Details
Closed on
Jul 16, 2014
Sold by
Ludlum William J and Ludlum Gail M
Bought by
Ludlum Gail M
Current Estimated Value
Purchase Details
Closed on
Dec 10, 2008
Sold by
Mccormick Michael and Mccormick Nora
Bought by
Ludlum William and Ludlum Gail
Purchase Details
Closed on
Jul 27, 2000
Sold by
Bank Of New York
Bought by
Mccormick Michael
Home Financials for this Owner
Home Financials are based on the most recent Mortgage that was taken out on this home.
Original Mortgage
$165,300
Interest Rate
8.21%
Purchase Details
Closed on
Oct 7, 1995
Sold by
Gurzo Joseph
Bought by
Schweitzer Joni
Home Financials for this Owner
Home Financials are based on the most recent Mortgage that was taken out on this home.
Original Mortgage
$80,000
Interest Rate
7.6%
Create a Home Valuation Report for This Property
The Home Valuation Report is an in-depth analysis detailing your home's value as well as a comparison with similar homes in the area
Home Values in the Area
Average Home Value in this Area
Purchase History
| Date | Buyer | Sale Price | Title Company |
|---|---|---|---|
| Ludlum Gail M | -- | None Available | |
| Ludlum William | $550,000 | Two Rivers Title Co Llc | |
| Mccormick Michael | $174,000 | -- | |
| Schweitzer Joni | $120,000 | -- |
Source: Public Records
Mortgage History
| Date | Status | Borrower | Loan Amount |
|---|---|---|---|
| Previous Owner | Mccormick Michael | $165,300 | |
| Previous Owner | Schweitzer Joni | $80,000 |
Source: Public Records
Tax History Compared to Growth
Tax History
| Year | Tax Paid | Tax Assessment Tax Assessment Total Assessment is a certain percentage of the fair market value that is determined by local assessors to be the total taxable value of land and additions on the property. | Land | Improvement |
|---|---|---|---|---|
| 2025 | $9,098 | $625,300 | $455,100 | $170,200 |
| 2024 | $8,792 | $625,300 | $455,100 | $170,200 |
| 2023 | $8,792 | $625,300 | $455,100 | $170,200 |
| 2022 | $8,485 | $625,300 | $455,100 | $170,200 |
| 2021 | $8,485 | $625,300 | $455,100 | $170,200 |
| 2020 | $8,410 | $625,300 | $455,100 | $170,200 |
| 2019 | $8,410 | $625,300 | $455,100 | $170,200 |
| 2018 | $7,722 | $625,300 | $455,100 | $170,200 |
| 2017 | $7,535 | $625,300 | $455,100 | $170,200 |
| 2016 | $6,346 | $332,100 | $160,100 | $172,000 |
| 2015 | $6,661 | $347,100 | $175,100 | $172,000 |
| 2014 | $6,329 | $327,100 | $155,100 | $172,000 |
Source: Public Records
Map
Nearby Homes
- 303 11th Ave
- 307 11th Ave Unit 307
- 301 11th Ave
- 1101 B St
- 309 11th Ave Unit 309
- 309 11th Ave Unit B
- 309 11th Ave Unit EAST
- 311 11th Ave
- 1103 B St
- 304 12th Ave
- 306 12th Ave
- 1105 B St
- 219-211 11th Ave Unit 2
- 300 12th Ave
- 313 11th Ave
- 313 11th Ave Unit 5
- 304 11th Ave
- 302 11th Ave
- 308 12th Ave
- 308 12th Ave Unit Front