Estimated Value: $151,082 - $208,000
2
Beds
1
Bath
1,404
Sq Ft
$132/Sq Ft
Est. Value
About This Home
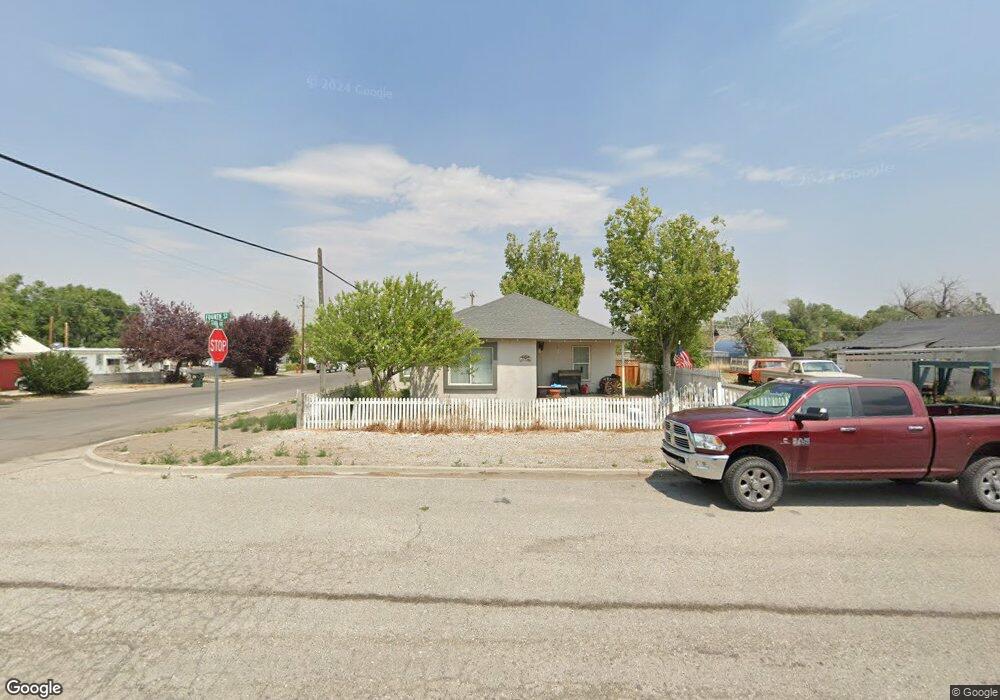
This home is located at 305 4th St, Wells, NV 89835 and is currently estimated at $185,021, approximately $131 per square foot. 305 4th St is a home with nearby schools including Wells Elementary School, Wells Junior High School, and Wells High School.
Ownership History
Date
Name
Owned For
Owner Type
Purchase Details
Closed on
Apr 12, 2021
Sold by
Rudnick Oscar and Rudnick Libby
Bought by
Rudnick Oscar L and Rudnick Estates Trust
Current Estimated Value
Purchase Details
Closed on
Mar 18, 2021
Sold by
Rudnick Oscar L and Rudnick Estates Trust
Bought by
Rudnick Keyesville Llc
Purchase Details
Closed on
Mar 8, 2011
Sold by
Uhlig Brock F and Uhlig Jamie A
Bought by
Cook Robert
Home Financials for this Owner
Home Financials are based on the most recent Mortgage that was taken out on this home.
Original Mortgage
$129,608
Outstanding Balance
$89,763
Interest Rate
4.96%
Mortgage Type
FHA
Estimated Equity
$95,258
Purchase Details
Closed on
Aug 15, 2007
Sold by
Jardee Amanda
Bought by
Uhlig Brock F and Uhlig Jamie A
Home Financials for this Owner
Home Financials are based on the most recent Mortgage that was taken out on this home.
Original Mortgage
$104,000
Interest Rate
6.67%
Mortgage Type
Purchase Money Mortgage
Create a Home Valuation Report for This Property
The Home Valuation Report is an in-depth analysis detailing your home's value as well as a comparison with similar homes in the area
Home Values in the Area
Average Home Value in this Area
Purchase History
| Date | Buyer | Sale Price | Title Company |
|---|---|---|---|
| Rudnick Oscar L | -- | None Available | |
| Rudnick Keyesville Llc | -- | None Available | |
| Cook Robert | $133,000 | Stewart Title Elko | |
| Uhlig Brock F | $130,000 | Stewart Title | |
| Jardee Amanda | -- | Stewart Title |
Source: Public Records
Mortgage History
| Date | Status | Borrower | Loan Amount |
|---|---|---|---|
| Open | Cook Robert | $129,608 | |
| Previous Owner | Uhlig Brock F | $104,000 |
Source: Public Records
Tax History Compared to Growth
Tax History
| Year | Tax Paid | Tax Assessment Tax Assessment Total Assessment is a certain percentage of the fair market value that is determined by local assessors to be the total taxable value of land and additions on the property. | Land | Improvement |
|---|---|---|---|---|
| 2025 | $537 | $25,194 | $6,300 | $18,894 |
| 2024 | $537 | $25,044 | $6,300 | $18,744 |
| 2023 | $472 | $18,182 | $1,024 | $17,158 |
| 2022 | $459 | $15,302 | $1,024 | $14,278 |
| 2021 | $445 | $14,703 | $1,024 | $13,679 |
| 2020 | $432 | $14,539 | $1,024 | $13,515 |
| 2019 | $420 | $13,680 | $1,024 | $12,656 |
| 2018 | $413 | $13,443 | $1,024 | $12,419 |
| 2017 | $396 | $13,049 | $1,024 | $12,025 |
| 2016 | $384 | $12,349 | $1,024 | $11,325 |
| 2015 | $373 | $12,045 | $1,024 | $11,021 |
| 2014 | $362 | $11,114 | $1,024 | $10,090 |
Source: Public Records
Map
Nearby Homes