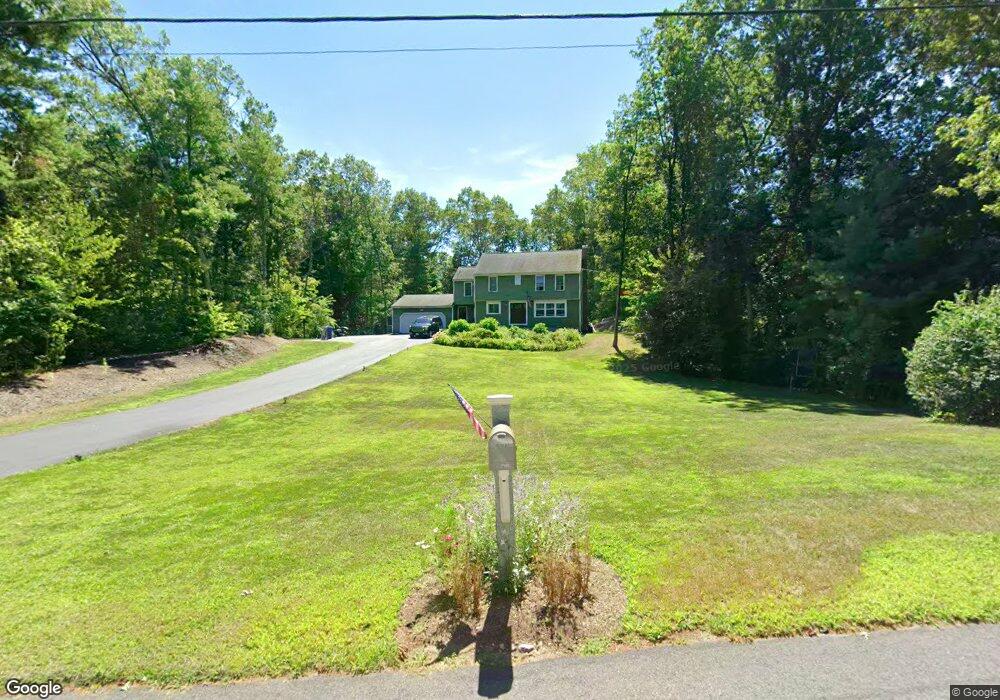
305 Bennett St Unit 305 Wrentham, MA 02093
Estimated Value: $706,000 - $772,000
3
Beds
2
Baths
2,830
Sq Ft
$260/Sq Ft
Est. Value
About This Home
This home is located at 305 Bennett St Unit 305, Wrentham, MA 02093 and is currently estimated at $735,354, approximately $259 per square foot. 305 Bennett St Unit 305 is a home located in Norfolk County with nearby schools including Delaney Elementary School and Charles E Roderick.
Ownership History
Date
Name
Owned For
Owner Type
Purchase Details
Closed on
Jun 2, 2014
Sold by
Duffy Jennifer
Bought by
Fox Corey and Fox Patricia N
Current Estimated Value
Home Financials for this Owner
Home Financials are based on the most recent Mortgage that was taken out on this home.
Original Mortgage
$339,625
Outstanding Balance
$253,576
Interest Rate
4.26%
Mortgage Type
New Conventional
Estimated Equity
$481,778
Purchase Details
Closed on
Oct 28, 2008
Sold by
Fisher John and Fisher Marlene M
Bought by
Duffy Jennifer
Purchase Details
Closed on
May 2, 1988
Sold by
Mueller Dennis
Bought by
Fisher John
Create a Home Valuation Report for This Property
The Home Valuation Report is an in-depth analysis detailing your home's value as well as a comparison with similar homes in the area
Purchase History
| Date | Buyer | Sale Price | Title Company |
|---|---|---|---|
| Fox Corey | $357,500 | -- | |
| Fox Corey | $357,500 | -- | |
| Duffy Jennifer | $366,740 | -- | |
| Duffy Jennifer | $366,740 | -- | |
| Fisher John | $210,000 | -- |
Source: Public Records
Mortgage History
| Date | Status | Borrower | Loan Amount |
|---|---|---|---|
| Open | Fox Corey | $339,625 | |
| Closed | Fisher John | $339,625 | |
| Previous Owner | Fisher John | $296,000 | |
| Previous Owner | Fisher John | $296,000 |
Source: Public Records
Tax History
| Year | Tax Paid | Tax Assessment Tax Assessment Total Assessment is a certain percentage of the fair market value that is determined by local assessors to be the total taxable value of land and additions on the property. | Land | Improvement |
|---|---|---|---|---|
| 2025 | $7,048 | $608,100 | $302,800 | $305,300 |
| 2024 | $6,894 | $574,500 | $302,800 | $271,700 |
| 2023 | $6,604 | $523,300 | $275,200 | $248,100 |
| 2022 | $6,363 | $465,500 | $256,700 | $208,800 |
| 2021 | $5,855 | $416,100 | $224,100 | $192,000 |
| 2020 | $5,766 | $404,600 | $199,300 | $205,300 |
| 2019 | $5,580 | $395,200 | $199,300 | $195,900 |
| 2018 | $5,632 | $395,500 | $199,500 | $196,000 |
| 2017 | $5,287 | $371,000 | $195,700 | $175,300 |
| 2016 | $5,169 | $362,000 | $190,000 | $172,000 |
| 2015 | $5,114 | $341,400 | $182,700 | $158,700 |
| 2014 | $5,058 | $330,400 | $175,700 | $154,700 |
Source: Public Records
Map
Nearby Homes
- 175 Pokanoket Path
- 14 Earle Stewart Ln Unit Lot 3
- 1204 South St
- 11 Earle Stewart Ln Unit Lot 2
- 1222 South St
- 18 A St
- 6 Woodchester Rd
- 19 Chestnut St Lot 2
- 19 Chestnut St Lot 3
- 215 South St
- 0 Fall Ln
- 1 Chestnut St
- 10 Nature View Dr
- 15 Nature View Dr
- 149 Arnold St
- 18 Manchester Dr
- 8 Aspen Way
- 72 Uncas Ave Unit 1
- 112 Taunton St
- 300 Lafayette Ave
Your Personal Tour Guide
Ask me questions while you tour the home.