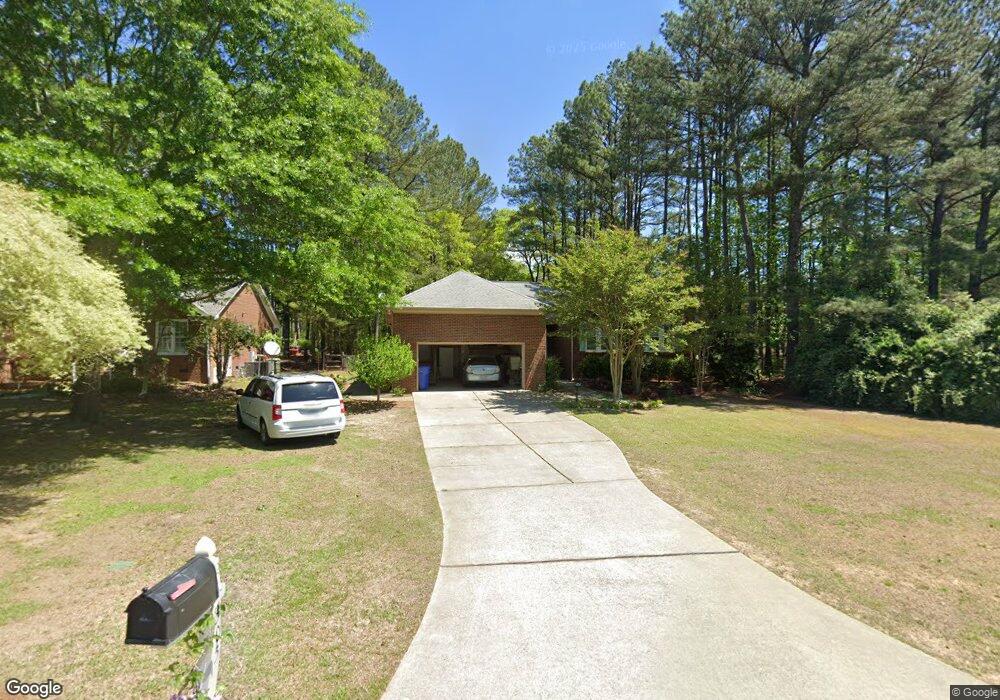
305 Bevis Marks Dr Fuquay Varina, NC 27526
Estimated Value: $398,000 - $452,000
3
Beds
2
Baths
1,735
Sq Ft
$245/Sq Ft
Est. Value
About This Home
This home is located at 305 Bevis Marks Dr, Fuquay Varina, NC 27526 and is currently estimated at $425,806, approximately $245 per square foot. 305 Bevis Marks Dr is a home located in Wake County.
Ownership History
Date
Name
Owned For
Owner Type
Purchase Details
Closed on
Jun 7, 2017
Sold by
Hart Carol
Bought by
Hart Carol
Current Estimated Value
Purchase Details
Closed on
Apr 29, 2010
Sold by
Odom Joseph Bryan and Odom Annette Christopher
Bought by
Hart Carol J
Purchase Details
Closed on
Aug 23, 2005
Sold by
Nell David B and Nell Sharon K
Bought by
Odom Joseph Bryant and Odom Annette Christopher
Purchase Details
Closed on
Mar 29, 2001
Sold by
Totterton Fredrick E
Bought by
Nell David B and Nell Sharon K
Home Financials for this Owner
Home Financials are based on the most recent Mortgage that was taken out on this home.
Original Mortgage
$171,147
Interest Rate
7.02%
Mortgage Type
FHA
Purchase Details
Closed on
Jul 28, 2000
Sold by
West David L
Bought by
Tetterton Fredrick E
Home Financials for this Owner
Home Financials are based on the most recent Mortgage that was taken out on this home.
Original Mortgage
$169,000
Interest Rate
8.23%
Create a Home Valuation Report for This Property
The Home Valuation Report is an in-depth analysis detailing your home's value as well as a comparison with similar homes in the area
Home Values in the Area
Average Home Value in this Area
Purchase History
| Date | Buyer | Sale Price | Title Company |
|---|---|---|---|
| Hart Carol | -- | None Available | |
| Hart Carol J | $190,000 | None Available | |
| Odom Joseph Bryant | $183,000 | None Available | |
| Nell David B | $172,500 | -- | |
| Tetterton Fredrick E | $167,000 | -- |
Source: Public Records
Mortgage History
| Date | Status | Borrower | Loan Amount |
|---|---|---|---|
| Previous Owner | Nell David B | $171,147 | |
| Previous Owner | Tetterton Fredrick E | $169,000 |
Source: Public Records
Tax History Compared to Growth
Tax History
| Year | Tax Paid | Tax Assessment Tax Assessment Total Assessment is a certain percentage of the fair market value that is determined by local assessors to be the total taxable value of land and additions on the property. | Land | Improvement |
|---|---|---|---|---|
| 2025 | $3,650 | $414,841 | $105,000 | $309,841 |
| 2024 | $3,635 | $414,841 | $105,000 | $309,841 |
| 2023 | $2,866 | $255,936 | $48,000 | $207,936 |
| 2022 | $2,693 | $255,936 | $48,000 | $207,936 |
| 2021 | $2,567 | $255,936 | $48,000 | $207,936 |
| 2020 | $2,567 | $255,936 | $48,000 | $207,936 |
| 2019 | $2,490 | $214,218 | $42,000 | $172,218 |
| 2018 | $2,348 | $214,218 | $42,000 | $172,218 |
| 2017 | $2,264 | $214,218 | $42,000 | $172,218 |
| 2016 | $2,233 | $214,218 | $42,000 | $172,218 |
| 2015 | $2,045 | $202,565 | $38,000 | $164,565 |
| 2014 | $1,971 | $202,565 | $38,000 | $164,565 |
Source: Public Records
Map
Nearby Homes
- 918 Kensley Grove Ln
- 918 Kensley Grove Ln Unit 66
- 917 Kensley Grove Ln
- 917 Kensley Grove Ln Unit 31
- 919 Kensley Grove Ln Unit 32
- Litchfield Plan at Kensley Grove
- 922 Kensley Grove Ln
- 922 Kensley Grove Ln Unit 64
- 934 Kensley Grove Ln
- 934 Kensley Grove Ln Unit 60
- 924 Kensley Grove Ln
- 924 Kensley Grove Ln Unit 63
- 928 Kensley Grove Ln Unit 61
- 804 Kensley Grove Ln Unit 9
- 806 Kensley Grove Ln Unit 8
- 1021 Old Baron Dr
- 425 Pine Burr St
- 747 Creekway Dr
- 548 Barneswyck Dr
- 516 Barneswyck Dr
- 303 Bevis Marks Dr
- 903 Old Wyck Dr
- 307 Bevis Marks Dr
- 905 Oldwyck Dr
- 803 Oldwyck Dr
- 304 Bevis Marks Dr
- 900 Oldwyck Dr
- 902 Oldwyck Dr
- 907 Oldwyck Dr
- 302 Bevis Marks Dr
- 906 Oldwyck Dr
- 906 Old Wyck Dr
- 904 Old Wyck
- 908 Oldwyck Dr
- 815 Barneswyck Dr
- 1087 Hodgson Ln Unit Lot 1
- 804 Oldwyck Dr
- 813 Barneswyck Dr
- 1091 Hodgson Ln Unit Lot 2
- 802 Oldwyck Dr