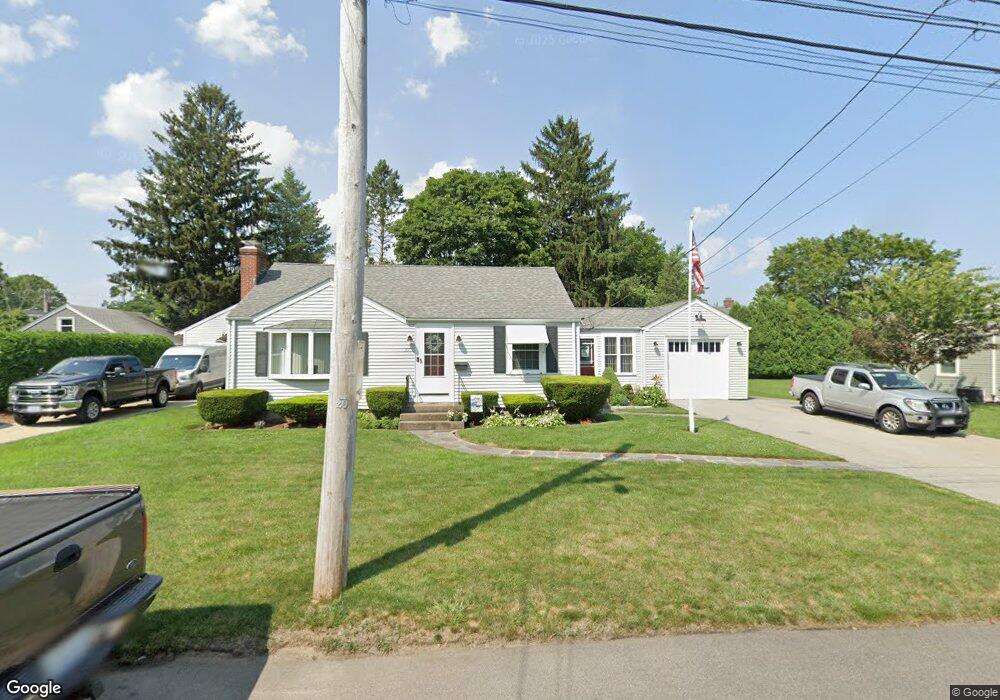
305 Chapmans Ave Warwick, RI 02886
Greenwood NeighborhoodEstimated Value: $332,000 - $546,000
1
Bed
1
Bath
884
Sq Ft
$457/Sq Ft
Est. Value
About This Home
This home is located at 305 Chapmans Ave, Warwick, RI 02886 and is currently estimated at $403,980, approximately $456 per square foot. 305 Chapmans Ave is a home located in Kent County with nearby schools including St Rose Of Lima School, Islamic School of Rhode Island, and St Joseph School.
Ownership History
Date
Name
Owned For
Owner Type
Purchase Details
Closed on
Mar 5, 2003
Sold by
Fish Lioyd S
Bought by
Latour Paul R
Current Estimated Value
Home Financials for this Owner
Home Financials are based on the most recent Mortgage that was taken out on this home.
Original Mortgage
$134,400
Interest Rate
5.95%
Mortgage Type
Purchase Money Mortgage
Create a Home Valuation Report for This Property
The Home Valuation Report is an in-depth analysis detailing your home's value as well as a comparison with similar homes in the area
Home Values in the Area
Average Home Value in this Area
Purchase History
| Date | Buyer | Sale Price | Title Company |
|---|---|---|---|
| Latour Paul R | $218,000 | -- |
Source: Public Records
Mortgage History
| Date | Status | Borrower | Loan Amount |
|---|---|---|---|
| Open | Latour Paul R | $18,000 | |
| Closed | Latour Paul R | $130,000 | |
| Closed | Latour Paul R | $38,000 | |
| Closed | Latour Paul R | $134,400 |
Source: Public Records
Tax History
| Year | Tax Paid | Tax Assessment Tax Assessment Total Assessment is a certain percentage of the fair market value that is determined by local assessors to be the total taxable value of land and additions on the property. | Land | Improvement |
|---|---|---|---|---|
| 2025 | $4,669 | $367,600 | $141,600 | $226,000 |
| 2024 | $4,298 | $297,000 | $123,100 | $173,900 |
| 2023 | $4,214 | $297,000 | $123,100 | $173,900 |
| 2022 | $4,224 | $225,500 | $99,200 | $126,300 |
| 2021 | $4,224 | $225,500 | $99,200 | $126,300 |
| 2020 | $4,224 | $225,500 | $99,200 | $126,300 |
| 2019 | $4,224 | $225,500 | $99,200 | $126,300 |
| 2018 | $3,869 | $186,000 | $92,300 | $93,700 |
| 2017 | $3,765 | $186,000 | $92,300 | $93,700 |
| 2016 | $3,765 | $186,000 | $92,300 | $93,700 |
| 2015 | $3,445 | $166,000 | $84,500 | $81,500 |
| 2014 | $3,330 | $166,000 | $84,500 | $81,500 |
| 2013 | $3,285 | $166,000 | $84,500 | $81,500 |
Source: Public Records
Map
Nearby Homes
- 333 Greenwood Ave
- 6 Lillian Ct
- 69 Haverhill Ave
- 833 Halifax Dr
- 892 Halifax Dr
- 122 Edaville Ct
- 123 Edman St
- 115 Edman St
- 27 Great Oak Dr
- 2907 Post Rd Unit 2
- 2907 Post Rd Unit 3
- 36 Great Oak Dr
- 139 Lancaster Ave
- 157 George Arden Ave
- 233 Palace Ave
- 143 Morse Ave
- 5 Barre Ct
- 84 Spruce St
- 45 Tourtelot Ave
- 14 W Natick Rd
- 315 Chapmans Ave
- 293 Chapmans Ave
- 1060 Main Ave
- 1074 Main Ave
- 321 Chapmans Ave
- 1044 Main Ave
- 308 Chapmans Ave
- 300 Chapmans Ave
- 1080 Main Ave
- 292 Chapmans Ave
- 1038 Main Ave
- 279 Chapmans Ave
- 288 Chapmans Ave
- 301 Hillard Ave
- 1032 Main Ave
- 285 Hillard Ave
- 333 Chapmans Ave
- 46 Alvin St
- 31 Freeman St
- 31 Alvin St
Your Personal Tour Guide
Ask me questions while you tour the home.