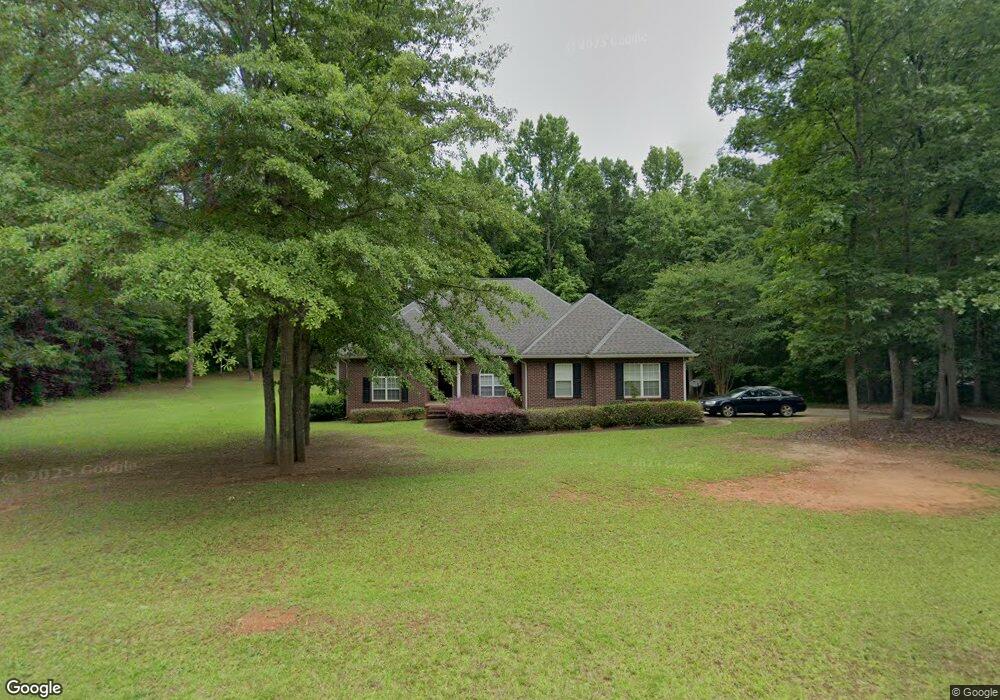
305 Corey Ct Macon, GA 31220
Estimated Value: $242,000 - $393,000
4
Beds
3
Baths
2,614
Sq Ft
$125/Sq Ft
Est. Value
About This Home
This home is located at 305 Corey Ct, Macon, GA 31220 and is currently estimated at $326,347, approximately $124 per square foot. 305 Corey Ct is a home located in Bibb County with nearby schools including Skyview Elementary School, Rutland Middle School, and Rutland High School.
Ownership History
Date
Name
Owned For
Owner Type
Purchase Details
Closed on
Oct 18, 2013
Sold by
Grinsted Denise and Grinsted Mark S
Bought by
Clements Arthur L and Clements Debbie L
Current Estimated Value
Home Financials for this Owner
Home Financials are based on the most recent Mortgage that was taken out on this home.
Original Mortgage
$182,841
Outstanding Balance
$137,087
Interest Rate
4.52%
Mortgage Type
VA
Estimated Equity
$189,260
Purchase Details
Closed on
Jun 27, 2008
Sold by
Federal Home Loan Mortgage Corporation
Bought by
Grinsted Denise and Grimsted Mark S
Home Financials for this Owner
Home Financials are based on the most recent Mortgage that was taken out on this home.
Original Mortgage
$149,651
Interest Rate
6.08%
Mortgage Type
FHA
Purchase Details
Closed on
Jan 2, 2008
Sold by
National City Bank
Bought by
Federal Home Loan Mortgage Corporation
Purchase Details
Closed on
May 25, 2001
Bought by
Grable Maurice and Grable Buffy
Create a Home Valuation Report for This Property
The Home Valuation Report is an in-depth analysis detailing your home's value as well as a comparison with similar homes in the area
Purchase History
| Date | Buyer | Sale Price | Title Company |
|---|---|---|---|
| Clements Arthur L | $177,000 | Liberty Creek Tite Llc | |
| Grinsted Denise | -- | None Available | |
| Federal Home Loan Mortgage Corporation | -- | None Available | |
| National City Bank | $169,689 | None Available | |
| Grable Maurice | $18,500 | -- |
Source: Public Records
Mortgage History
| Date | Status | Borrower | Loan Amount |
|---|---|---|---|
| Open | Clements Arthur L | $182,841 | |
| Previous Owner | Grinsted Denise | $149,651 |
Source: Public Records
Tax History
| Year | Tax Paid | Tax Assessment Tax Assessment Total Assessment is a certain percentage of the fair market value that is determined by local assessors to be the total taxable value of land and additions on the property. | Land | Improvement |
|---|---|---|---|---|
| 2025 | $2,079 | $91,606 | $9,000 | $82,606 |
| 2024 | $2,149 | $91,606 | $9,000 | $82,606 |
| 2023 | $1,692 | $91,606 | $9,000 | $82,606 |
| 2022 | $2,948 | $92,158 | $13,600 | $78,558 |
| 2021 | $3,236 | $92,158 | $13,600 | $78,558 |
| 2020 | $3,299 | $91,976 | $13,600 | $78,376 |
| 2019 | $3,320 | $91,809 | $13,600 | $78,209 |
| 2018 | $5,264 | $91,809 | $13,600 | $78,209 |
| 2017 | $3,177 | $91,809 | $13,600 | $78,209 |
| 2016 | $3,127 | $90,394 | $13,600 | $76,794 |
| 2015 | $4,427 | $90,394 | $13,600 | $76,794 |
| 2014 | $3,472 | $90,394 | $13,600 | $76,794 |
Source: Public Records
Map
Nearby Homes
- 137 Shady Dale Dr
- 8294 Shelley Trail
- 8290 Lower Thomaston Rd
- 8290 Lower Thomaston Rd
- 402 Harbor Cove Dr
- 402 Harbor Cove Dr Unit 32
- 104 Peninsula Ave
- 104 Peninsula Ave Unit LOT 49
- 112 Peninsula Ave
- 140 Peninsula Ave
- 177 Peninsula Ave
- 156 Peninsula Ave
- 1302 Barrington Place Cove
- 1157 Barrington Place Way Unit 22
- 1409 Barrington Place Terrace
- 1150 Barrington Place Way
- 1154 Barrington Place Way
- 1162 Barrington Place Way
- 1166 Barrington Place Way
- 1175 Barrington Place Way
- 312 Corey Ct
- 301 Corey Ct
- 309 Corey Ct
- 309 Corey Ct Unit 5
- 308 Corey Ct
- 308 Corey Ct Unit 8
- 104 NW Pointe Dr
- 304 Corey Ct
- 8950 Thomaston Rd
- 112 NW Pointe Dr
- 240 NW Pointe Dr
- 100 NW Pointe Dr
- 313 Corey Ct
- 405 Chris Rd
- 409 Chris Rd
- 401 Chris Rd
- 111 NW Pointe Dr Unit 41,42,43
- 111 NW Pointe Dr
- 8961 Thomaston Rd
- 413 Chris Rd
Your Personal Tour Guide
Ask me questions while you tour the home.