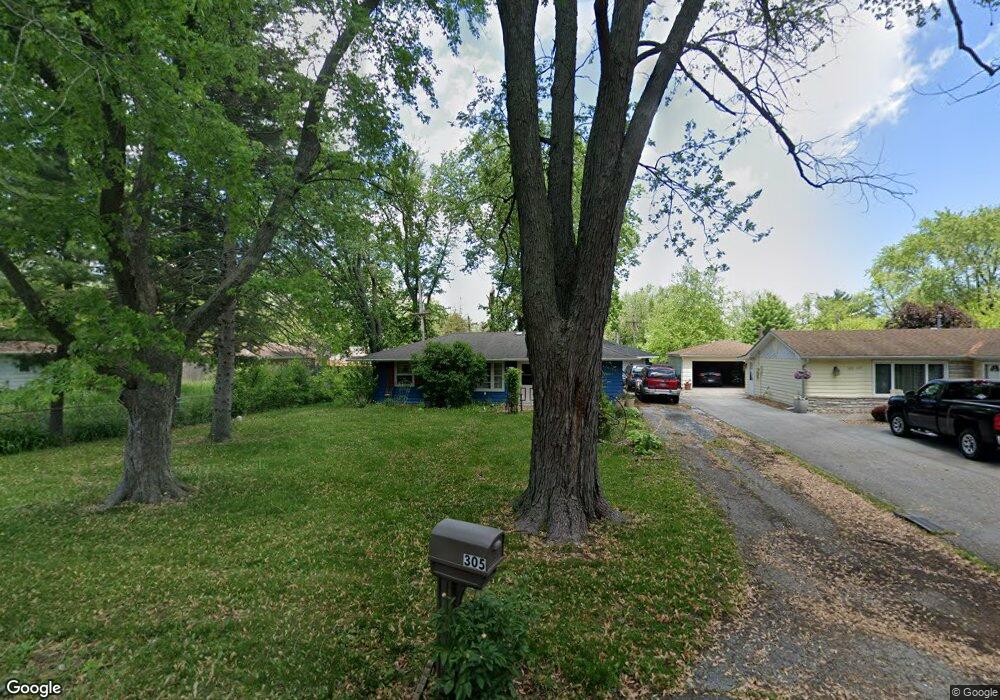
305 Craig Ct Steger, IL 60475
Estimated Value: $166,000 - $193,000
3
Beds
2
Baths
1,180
Sq Ft
$150/Sq Ft
Est. Value
About This Home
This home is located at 305 Craig Ct, Steger, IL 60475 and is currently estimated at $176,688, approximately $149 per square foot. 305 Craig Ct is a home located in Will County with nearby schools including Steger Primary Center, Columbia Central School, and Steger Intermediate Center.
Ownership History
Date
Name
Owned For
Owner Type
Purchase Details
Closed on
Jul 31, 2009
Sold by
Begesha John J and Begesha Deirdra J
Bought by
Gaskill Anthony E and Holman Benjamin
Current Estimated Value
Home Financials for this Owner
Home Financials are based on the most recent Mortgage that was taken out on this home.
Original Mortgage
$112,818
Outstanding Balance
$73,858
Interest Rate
5.29%
Mortgage Type
FHA
Estimated Equity
$102,830
Purchase Details
Closed on
May 3, 1996
Sold by
Passwello Albert J and Passwello Elyse J
Bought by
Verde Deirdra J and Begesha John J
Home Financials for this Owner
Home Financials are based on the most recent Mortgage that was taken out on this home.
Original Mortgage
$86,650
Interest Rate
7.78%
Mortgage Type
FHA
Create a Home Valuation Report for This Property
The Home Valuation Report is an in-depth analysis detailing your home's value as well as a comparison with similar homes in the area
Home Values in the Area
Average Home Value in this Area
Purchase History
| Date | Buyer | Sale Price | Title Company |
|---|---|---|---|
| Gaskill Anthony E | $115,000 | None Available | |
| Verde Deirdra J | $87,000 | Greater Illinois Title Compa | |
| Verd Deirdra J | $87,000 | -- |
Source: Public Records
Mortgage History
| Date | Status | Borrower | Loan Amount |
|---|---|---|---|
| Open | Gaskill Anthony E | $112,818 | |
| Previous Owner | Verd Deirdra J | $86,650 |
Source: Public Records
Tax History Compared to Growth
Tax History
| Year | Tax Paid | Tax Assessment Tax Assessment Total Assessment is a certain percentage of the fair market value that is determined by local assessors to be the total taxable value of land and additions on the property. | Land | Improvement |
|---|---|---|---|---|
| 2024 | $4,869 | $55,063 | $10,518 | $44,545 |
| 2023 | $4,869 | $49,168 | $9,392 | $39,776 |
| 2022 | $4,290 | $43,697 | $8,347 | $35,350 |
| 2021 | $4,002 | $40,008 | $7,642 | $32,366 |
| 2020 | $3,841 | $37,496 | $7,162 | $30,334 |
| 2019 | $3,623 | $35,240 | $6,731 | $28,509 |
| 2018 | $3,482 | $34,481 | $6,586 | $27,895 |
| 2017 | $3,386 | $31,765 | $6,067 | $25,698 |
| 2016 | $3,560 | $31,560 | $6,028 | $25,532 |
| 2015 | $3,372 | $30,716 | $5,867 | $24,849 |
| 2014 | $3,372 | $31,026 | $5,926 | $25,100 |
| 2013 | $3,372 | $32,512 | $6,210 | $26,302 |
Source: Public Records
Map
Nearby Homes
- 3533 Ashland Ave
- 23614 S Ashland Ave
- 200 Crystal Ln
- 3512 John St
- 3514 Ashland Ave
- 23627 S Ashland Ave
- 3436 Sally Dr
- 3813 Morgan St
- 188 Cedarwood Dr
- 186 Cedarwood Dr
- 3502 Morgan St
- 23751 S Loomis St
- 173 Cedarwood Dr
- 1750 Richton Rd
- 92 W 37th St
- 23810 S Ashland Ave
- 3541 Peoria St
- 3439 Sangamon St
- 3505 Peoria St
- 23922 S Cretewood Ln