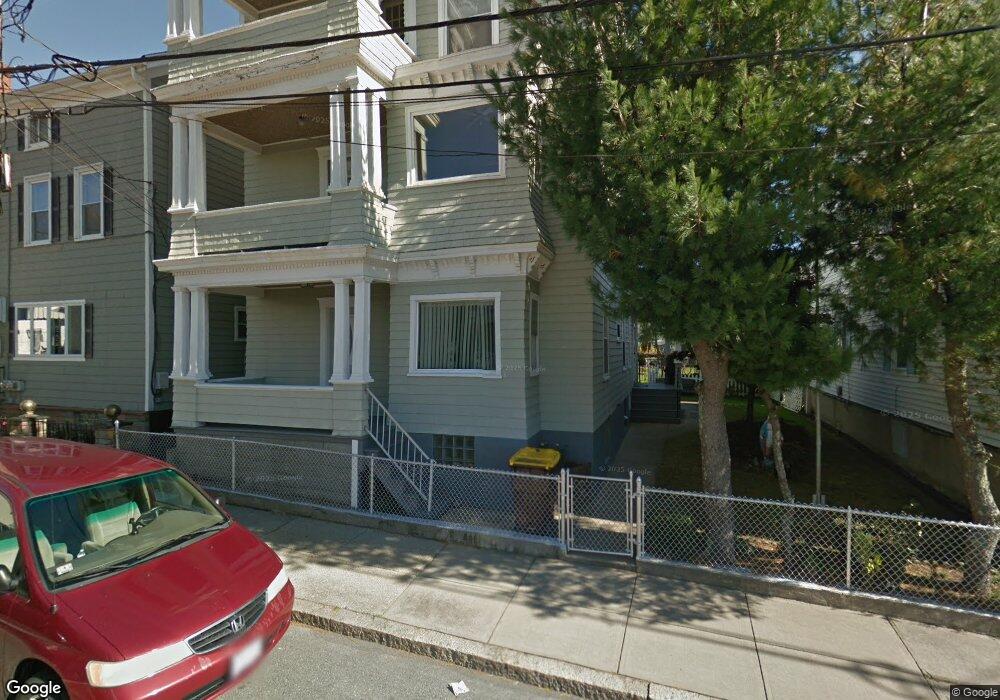
305 Davis St Fall River, MA 02720
Oak Grove Village NeighborhoodEstimated Value: $518,074 - $670,000
8
Beds
3
Baths
2,712
Sq Ft
$214/Sq Ft
Est. Value
About This Home
This home is located at 305 Davis St, Fall River, MA 02720 and is currently estimated at $580,519, approximately $214 per square foot. 305 Davis St is a home located in Bristol County with nearby schools including Mary Fonseca Elementary School, Talbot Innovation School, and B M C Durfee High School.
Ownership History
Date
Name
Owned For
Owner Type
Purchase Details
Closed on
Mar 28, 2025
Sold by
Silva Maria B and Silva Claudio B
Bought by
Silva Claudio B and Silva Maria B
Current Estimated Value
Purchase Details
Closed on
May 16, 1994
Sold by
Mcnerney Margaret B and Branco Mary C
Bought by
Silva Deoliinda and Silva Mary
Home Financials for this Owner
Home Financials are based on the most recent Mortgage that was taken out on this home.
Original Mortgage
$55,000
Interest Rate
7.93%
Mortgage Type
Purchase Money Mortgage
Create a Home Valuation Report for This Property
The Home Valuation Report is an in-depth analysis detailing your home's value as well as a comparison with similar homes in the area
Home Values in the Area
Average Home Value in this Area
Purchase History
| Date | Buyer | Sale Price | Title Company |
|---|---|---|---|
| Silva Claudio B | -- | None Available | |
| Silva Claudio B | -- | None Available | |
| Silva Deoliinda | $127,000 | -- | |
| Silva Deoliinda | $127,000 | -- |
Source: Public Records
Mortgage History
| Date | Status | Borrower | Loan Amount |
|---|---|---|---|
| Previous Owner | Silva Deoliinda | $26,000 | |
| Previous Owner | Silva Deoliinda | $55,000 |
Source: Public Records
Tax History
| Year | Tax Paid | Tax Assessment Tax Assessment Total Assessment is a certain percentage of the fair market value that is determined by local assessors to be the total taxable value of land and additions on the property. | Land | Improvement |
|---|---|---|---|---|
| 2025 | $5,154 | $450,100 | $127,300 | $322,800 |
| 2024 | $4,935 | $429,500 | $122,400 | $307,100 |
| 2023 | $4,387 | $357,500 | $105,000 | $252,500 |
| 2022 | $3,887 | $308,000 | $95,400 | $212,600 |
| 2021 | $3,682 | $266,200 | $88,300 | $177,900 |
| 2020 | $3,328 | $230,300 | $84,500 | $145,800 |
| 2019 | $2,872 | $197,000 | $80,500 | $116,500 |
| 2018 | $2,608 | $178,400 | $79,000 | $99,400 |
| 2017 | $2,520 | $180,000 | $80,600 | $99,400 |
| 2016 | $2,466 | $180,900 | $83,900 | $97,000 |
| 2015 | $2,326 | $177,800 | $80,800 | $97,000 |
| 2014 | $2,404 | $191,100 | $85,100 | $106,000 |
Source: Public Records
Map
Nearby Homes
- 884 Cherry St
- 273 Tremont St
- 218 Plain St
- 217 Plain St
- 992 Pine St
- 243 Robeson St Unit 6
- 243 Robeson St Unit 3
- 45-47 Shawmut St
- 545 Robeson St
- 631 Walnut St
- 610 Walnut St
- 65 Bigelow St
- 869 Bedford St
- 528 Cherry St Unit 3
- 511 Bank St
- 84 Healy St
- 105 16th St
- 120 15th St Unit 5
- 464 Bank St Unit 10
- 501 Pine St
Your Personal Tour Guide
Ask me questions while you tour the home.