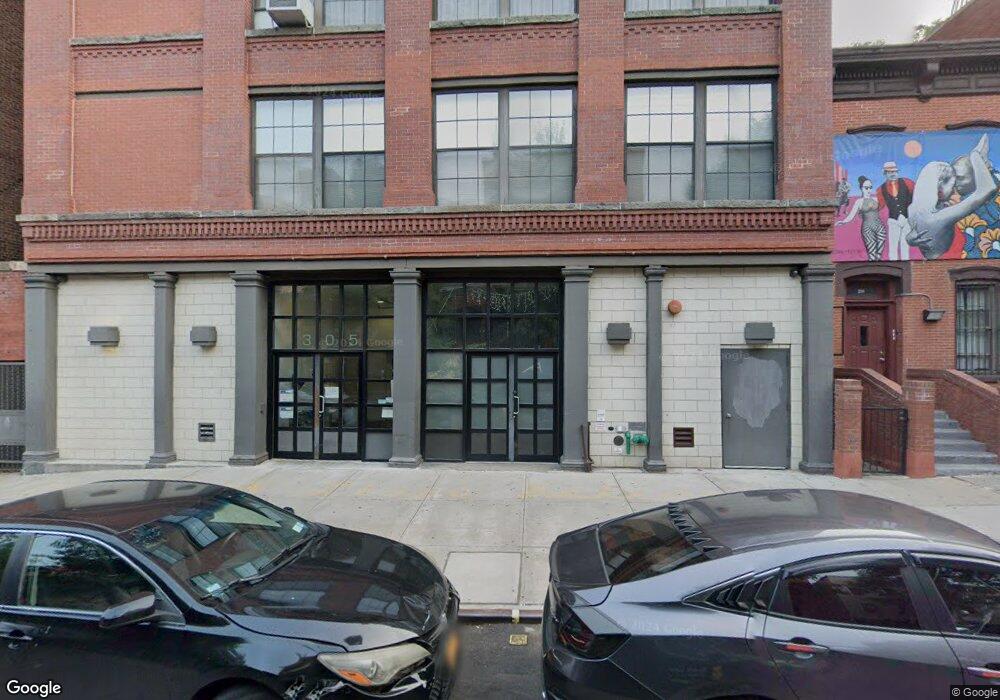
305 E 140 Th St Unit 5-A New York City, NY 10454
Mott Haven NeighborhoodEstimated Value: $504,000 - $1,352,000
--
Bed
1
Bath
1,981
Sq Ft
$552/Sq Ft
Est. Value
About This Home
This home is located at 305 E 140 Th St Unit 5-A, New York City, NY 10454 and is currently estimated at $1,094,362, approximately $552 per square foot. 305 E 140 Th St Unit 5-A is a home located in Bronx County with nearby schools including Middle School 223 Laboratory School of Finance and Technology, P.S. I.S. 224, and Academy of Applied Mathematics and Technology.
Ownership History
Date
Name
Owned For
Owner Type
Purchase Details
Closed on
Mar 28, 2022
Sold by
Allen-Lamphere Peter and Allen-Lamphere Reniqua
Bought by
Morel Suzanne and O'Neill Michael
Current Estimated Value
Home Financials for this Owner
Home Financials are based on the most recent Mortgage that was taken out on this home.
Original Mortgage
$908,000
Outstanding Balance
$851,588
Interest Rate
4.42%
Mortgage Type
Purchase Money Mortgage
Estimated Equity
$242,774
Purchase Details
Closed on
Apr 15, 2021
Sold by
Lamphere Peter
Bought by
Allen- Lamphere Peter and Allen- Lamphere Reniqua
Home Financials for this Owner
Home Financials are based on the most recent Mortgage that was taken out on this home.
Original Mortgage
$650,000
Interest Rate
2.9%
Mortgage Type
Purchase Money Mortgage
Purchase Details
Closed on
May 13, 2008
Sold by
Bronx Bricks Condominium
Bought by
Lamphere Peter
Create a Home Valuation Report for This Property
The Home Valuation Report is an in-depth analysis detailing your home's value as well as a comparison with similar homes in the area
Home Values in the Area
Average Home Value in this Area
Purchase History
| Date | Buyer | Sale Price | Title Company |
|---|---|---|---|
| Morel Suzanne | $1,135,000 | -- | |
| Morel Suzanne | $1,135,000 | -- | |
| Allen- Lamphere Peter | -- | -- | |
| Allen- Lamphere Peter | -- | -- | |
| Lamphere Peter | $789,144 | -- | |
| Lamphere Peter | $789,144 | -- |
Source: Public Records
Mortgage History
| Date | Status | Borrower | Loan Amount |
|---|---|---|---|
| Open | Morel Suzanne | $908,000 | |
| Closed | Morel Suzanne | $908,000 | |
| Previous Owner | Allen- Lamphere Peter | $650,000 |
Source: Public Records
Tax History Compared to Growth
Tax History
| Year | Tax Paid | Tax Assessment Tax Assessment Total Assessment is a certain percentage of the fair market value that is determined by local assessors to be the total taxable value of land and additions on the property. | Land | Improvement |
|---|---|---|---|---|
| 2025 | $8,387 | $85,833 | $2,815 | $83,018 |
| 2024 | $8,387 | $92,966 | $2,815 | $90,151 |
| 2023 | $4,713 | $92,293 | $2,815 | $89,478 |
| 2022 | $2,681 | $89,767 | $2,815 | $86,952 |
| 2021 | $2,920 | $86,256 | $2,815 | $83,441 |
| 2020 | $987 | $96,132 | $2,815 | $93,317 |
| 2019 | $788 | $90,700 | $2,815 | $87,885 |
| 2018 | $2,438 | $83,732 | $2,815 | $80,917 |
| 2017 | $2,313 | $71,660 | $2,815 | $68,845 |
| 2016 | $2,220 | $69,411 | $2,815 | $66,596 |
| 2015 | -- | $62,936 | $2,815 | $60,121 |
| 2014 | -- | $54,980 | $2,815 | $52,165 |
Source: Public Records
Map
Nearby Homes
- 320 E 141st St
- 339 E 140th St
- 342 E 141st St
- 225 E 138th St Unit 506
- 408 E 138th St
- 409 E 139th St
- 419 E 140th St
- 436 E 141st St
- 433 E 141st St
- 412 E 136th St
- 430 E 144th St
- 430 E 136th St
- 443 E 143rd St
- 442 E 136th St
- 441 E 144th St
- 444 E 146th St
- 446 E 146th St
- 439 E 147th St
- 299 E 150th St
- 440 E 148th St
- 305 E 140 Th St Unit 2 B
- 305 E 140 Th St Unit 4 B
- 305 E 140 Th St Unit 1 A
- 305 E 140 Th St Unit 3 A
- 305 E 140 Th St Unit 5 B
- 305 E 140 Th St Unit 2 A
- 305 E 140 Th St Unit 3 C
- 305 E 140 Th St Unit 4-A
- 305 E 140th St Unit 2B
- 305 E 140th St Unit 1A
- 305 E 140th St Unit 4B
- 305 E 140th St Unit 4C
- 305 E 140th St Unit 3B
- 305 E 140th St
- 305 E 140th St Unit 5A
- 305 E 140th St Unit 2C
- 305 E 140th St Unit 1B
- 305 E 140th St Unit 4A
- 305 E 140th St Unit 2A
- 305 E 140th St Unit 5B