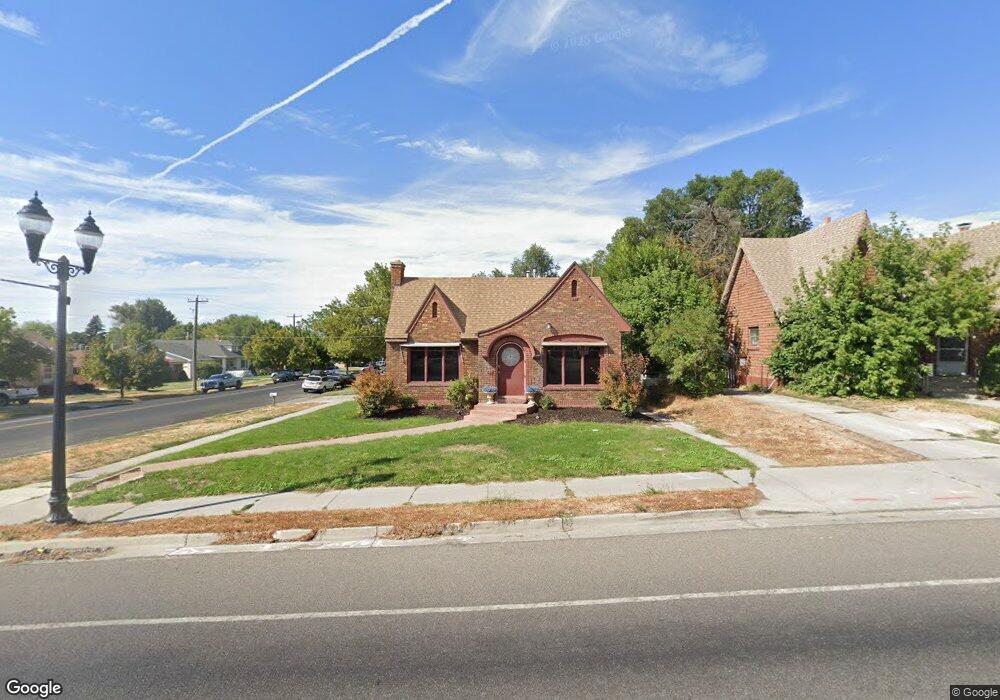
305 E 400 N Logan, UT 84321
Adams NeighborhoodEstimated Value: $381,090 - $405,000
Studio
--
Bath
1,338
Sq Ft
$296/Sq Ft
Est. Value
About This Home
This home is located at 305 E 400 N, Logan, UT 84321 and is currently estimated at $396,023, approximately $295 per square foot. 305 E 400 N is a home with nearby schools including Adams Elementary School, Mount Logan Middle School, and Logan High School.
Ownership History
Date
Name
Owned For
Owner Type
Purchase Details
Closed on
Oct 7, 2022
Sold by
Funk David C
Bought by
Funk Tamara D
Current Estimated Value
Purchase Details
Closed on
Aug 30, 2018
Sold by
Mtse Holdings 2018004 Llc
Bought by
Funk David C and Funk Tamara D
Purchase Details
Closed on
May 17, 2018
Sold by
Lowe Lorin T and Estate Of Mona W Lowe
Bought by
Mtse Holdings 2018004 Llc
Home Financials for this Owner
Home Financials are based on the most recent Mortgage that was taken out on this home.
Original Mortgage
$186,528
Interest Rate
4.4%
Mortgage Type
Purchase Money Mortgage
Create a Home Valuation Report for This Property
The Home Valuation Report is an in-depth analysis detailing your home's value as well as a comparison with similar homes in the area
Home Values in the Area
Average Home Value in this Area
Purchase History
| Date | Buyer | Sale Price | Title Company |
|---|---|---|---|
| Funk Tamara D | -- | Hickman Land Title | |
| Funk David C | -- | Hickman Land Title Company | |
| Mtse Holdings 2018004 Llc | -- | Hickman Land Title Co |
Source: Public Records
Mortgage History
| Date | Status | Borrower | Loan Amount |
|---|---|---|---|
| Previous Owner | Mtse Holdings 2018004 Llc | $186,528 |
Source: Public Records
Tax History
| Year | Tax Paid | Tax Assessment Tax Assessment Total Assessment is a certain percentage of the fair market value that is determined by local assessors to be the total taxable value of land and additions on the property. | Land | Improvement |
|---|---|---|---|---|
| 2025 | $1,859 | $240,460 | $0 | $0 |
| 2023 | $2,353 | $280,950 | $0 | $0 |
| 2022 | $242 | $269,350 | $0 | $0 |
| 2021 | $1,919 | $330,521 | $45,000 | $285,521 |
| 2020 | $1,707 | $264,632 | $45,000 | $219,632 |
| 2019 | $1,784 | $264,632 | $45,000 | $219,632 |
| 2018 | $1,780 | $241,100 | $45,000 | $196,100 |
| 2017 | $1,384 | $99,110 | $0 | $0 |
| 2016 | $1,435 | $94,710 | $0 | $0 |
| 2015 | $1,373 | $94,710 | $0 | $0 |
| 2014 | $1,241 | $94,710 | $0 | $0 |
| 2013 | -- | $90,595 | $0 | $0 |
Source: Public Records
Map
Nearby Homes
Your Personal Tour Guide
Ask me questions while you tour the home.