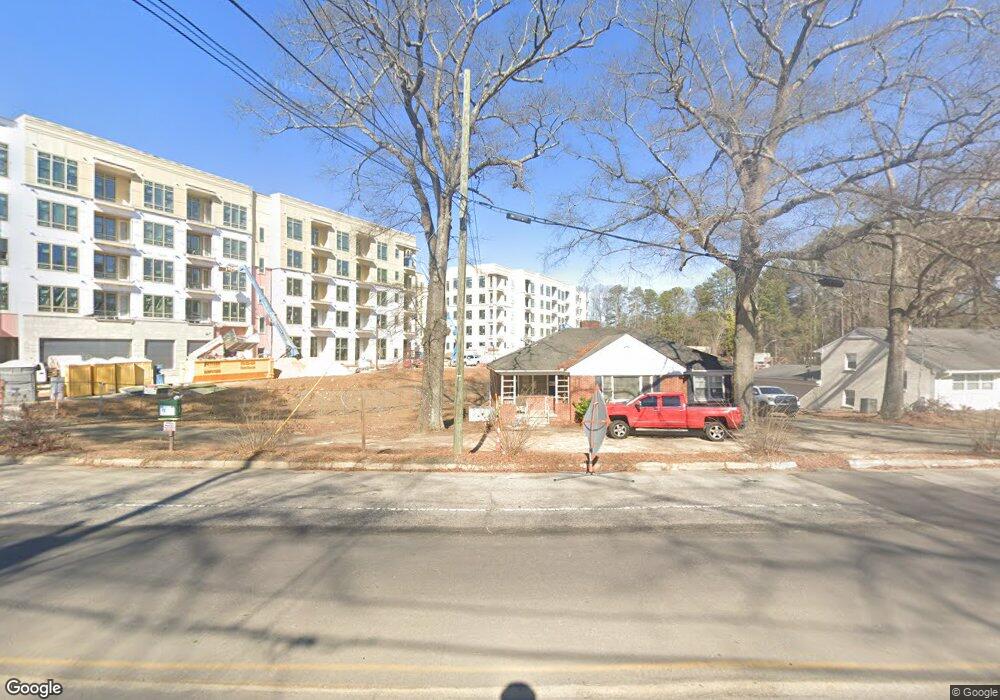
305 E Chatham St Cary, NC 27511
Downtown Cary NeighborhoodEstimated Value: $348,000
2
Beds
1
Bath
932
Sq Ft
$373/Sq Ft
Est. Value
About This Home
This home is located at 305 E Chatham St, Cary, NC 27511 and is currently priced at $348,000, approximately $373 per square foot. 305 E Chatham St is a home located in Wake County with nearby schools including Cary Elementary, East Cary Middle School, and Cary High School.
Ownership History
Date
Name
Owned For
Owner Type
Purchase Details
Closed on
Jan 9, 2023
Sold by
Meridian East Chatham Llc
Bought by
Bg Real Estate Ventures Llc
Current Estimated Value
Purchase Details
Closed on
Nov 20, 2018
Sold by
Jones Barry E
Bought by
B3 Ii Llc
Purchase Details
Closed on
Dec 27, 2006
Sold by
Smith Jimmie R and Smith Claire M
Bought by
Winborne Ian C
Home Financials for this Owner
Home Financials are based on the most recent Mortgage that was taken out on this home.
Original Mortgage
$75,000
Interest Rate
6.19%
Mortgage Type
Seller Take Back
Purchase Details
Closed on
Feb 23, 2005
Sold by
Smith Claire M and Smith Jimmie Ray
Bought by
Jimstone Llc
Purchase Details
Closed on
Feb 1, 2000
Sold by
Bell John D and Bell Pamela L
Bought by
Smith Jimmie R and Smith Claire M
Home Financials for this Owner
Home Financials are based on the most recent Mortgage that was taken out on this home.
Original Mortgage
$70,000
Interest Rate
8.11%
Purchase Details
Closed on
Mar 18, 1999
Sold by
Lutz James P and Lutz Joan L
Bought by
Bell John D
Home Financials for this Owner
Home Financials are based on the most recent Mortgage that was taken out on this home.
Original Mortgage
$47,920
Interest Rate
6.74%
Create a Home Valuation Report for This Property
The Home Valuation Report is an in-depth analysis detailing your home's value as well as a comparison with similar homes in the area
Home Values in the Area
Average Home Value in this Area
Purchase History
| Date | Buyer | Sale Price | Title Company |
|---|---|---|---|
| Bg Real Estate Ventures Llc | $218,500 | -- | |
| B3 Ii Llc | -- | None Available | |
| Winborne Ian C | $210,000 | None Available | |
| Jimstone Llc | -- | -- | |
| Smith Jimmie R | $62,500 | -- | |
| Bell John D | $60,000 | -- |
Source: Public Records
Mortgage History
| Date | Status | Borrower | Loan Amount |
|---|---|---|---|
| Previous Owner | Winborne Ian C | $75,000 | |
| Previous Owner | Smith Jimmie R | $70,000 | |
| Previous Owner | Bell John D | $47,920 |
Source: Public Records
Tax History
| Year | Tax Paid | Tax Assessment Tax Assessment Total Assessment is a certain percentage of the fair market value that is determined by local assessors to be the total taxable value of land and additions on the property. | Land | Improvement |
|---|---|---|---|---|
| 2022 | $2,089 | $214,525 | $152,219 | $62,306 |
| 2021 | $2,047 | $214,525 | $152,219 | $62,306 |
| 2020 | $2,058 | $214,525 | $152,219 | $62,306 |
| 2019 | $0 | $183,320 | $136,997 | $46,323 |
| 2018 | $0 | $183,320 | $136,997 | $46,323 |
| 2017 | $1,789 | $183,320 | $136,997 | $46,323 |
| 2016 | $1,762 | $183,320 | $136,997 | $46,323 |
| 2015 | $1,558 | $156,271 | $117,091 | $39,180 |
| 2014 | $1,470 | $156,271 | $117,091 | $39,180 |
Source: Public Records
Map
Nearby Homes
- 303 E Chatham St
- 303 - 305 Chatham St
- 303 E Chatham St
- 307 E Chatham St
- 311 E Chatham St
- 300 E Chatham St
- 306 E Chatham St
- 255 E Chatham St Unit C1
- 255 E Chatham St Unit B1
- 255 E Chatham St Unit A1
- 255 E Chatham St
- 229 E Chatham St
- 304 E Chatham St
- 310 E Chatham St
- 319 E Chatham St
- 230 E Chatham St
- 111 Hunter St
- 307 Waldo St
- 112 Hunter St
- 312 E Chatham St
Your Personal Tour Guide
Ask me questions while you tour the home.