NOT LISTED FOR SALE

305 E Franklin St Portage, WI 53901

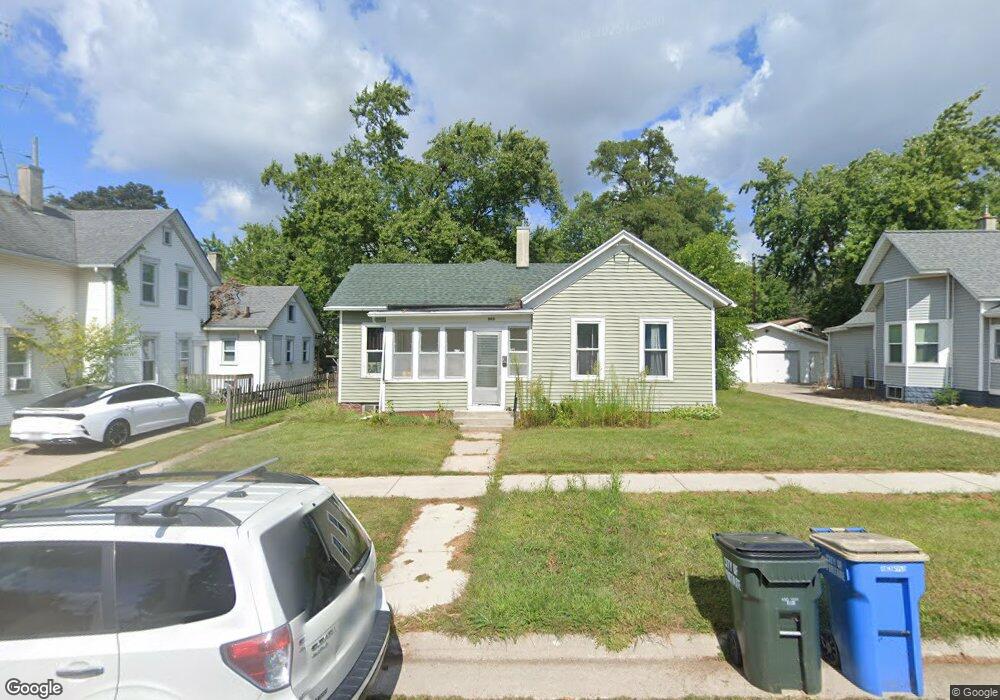
Estimated Value: $112,000 - $196,000

2 Beds
1 Bath
1,036 Sq Ft
$152/Sq Ft Est. Value

Last Sold July 27, 2023

Last sale price $107,800 $104 Per Sq Ft

Est. 46% increase in value since last sale

Current estimated payment $986/month

About This Home

Online Only Auction ending July 20th 2023 at 6:00pm. Terms: Minimum Bid of $70,000. 10% Buyer’s Fee added to high bid to determine total contract price, Buyer to sign Offer to Purchase w/no contingencies & all auction documents, a $5000 nonrefundable down payment to be paid to within 24hrs after auction ending, buyer to close on property on or before August 20th 2023 .Property will sell at or above the minimum bid. Open House Preview Day July 9th 11-1pm. List price is the minimum bid.

Ownership History

Date Name Owned For Owner Type

Purchase Details

Listed on
Jun 23, 2023
Closed on
Jul 27, 2023
Sold by
Connor Cordelia A
Bought by
Jenny Lynn Properties Llc
Seller's Agent
Travis Hamele
United Country Midwest Lifestyle Properties
Buyer's Agent
Travis Hamele
United Country Midwest Lifestyle Properties
List Price
$70,000
Sold Price
$107,800
Premium/Discount to List
$37,800
54%
Views
302
Current Estimated Value
$157,921

Home Financials for this Owner

Home Financials are based on the most recent Mortgage that was taken out on this home.
Estimated Appreciation
$50,121
Avg. Annual Appreciation
18.41%
Source: Public Records

Range of Values:

Collateral Analytics

Collateral Analytics Collateral Analytics AVMs (Automated Valuation Model) employ a number of statistical approaches combined with neighborhood-specific comparable selection guarantees the most up-to-date and precise valuations.

Not Available

Collateral Analytics does not have data for the current month. Please view the chart for historical values.

ICE

ICE Mortgage Technology ICE Mortgage Technology’s AVM (Automated Valuation Model) is a state-of-the-art online residential property valuation tool that provides a quick and accurate estimate of the value of almost any home in the U.S.

Not Available

ICE Mortgage Technology does not have data for the current month. Please view the chart for historical values.

First American

First American First American Data & Analytics’ next-generation AVM combines unrivaled data assets with a blended ensemble of valuation models to produce highly accurate, reliable valuations you can trust.

Not Available

First American does not have data for the current month. Please view the chart for historical values.

Quantarium

Quantarium Quantarium’s valuation service, repeatedly proven the industry’s most accurate and comprehensive, is supercharged with a self-learning and auto-tuning AI engine that continually becomes smarter and more accurate as it processes daily inputs from the industry’s leading RE data lake.

Not Available

Quantarium does not have data for the current month. Please view the chart for historical values.

Average Value
Not Available
List Price
Sold Price
Create a Home Valuation Report for This Property
The Home Valuation Report is an in-depth analysis detailing your home's value as well as a comparison with similar homes in the area

Home Values in the Area

Source: Public Records

Average Home Value in this Area


Source: Public Records

Purchase History

Date Buyer Sale Price Title Company
Jenny Lynn Properties Llc $107,800 Miller & Miller, Llc
Source: Public Records

Property History

Date Event Price List to Sale Price per Sq Ft Prior Sale
07/27/2023 07/27/23 Sold $107,800 +54.0% $104 / Sq Ft View Prior Sale
07/21/2023 07/21/23 Pending -- -- --
06/23/2023 06/23/23 For Sale $70,000 -- $68 / Sq Ft

Tax History Compared to Growth

Source: Public Records

Tax History

Year Tax Paid Tax Assessment Tax Assessment Total Assessment is a certain percentage of the fair market value that is determined by local assessors to be the total taxable value of land and additions on the property. Land Improvement
2024 $1,922 $107,800 $11,400 $96,400
2023 $2,191 $138,500 $11,400 $127,100
2022 $2,060 $118,900 $11,400 $107,500
2021 $1,863 $101,000 $11,400 $89,600
2020 $1,957 $101,000 $11,400 $89,600
2019 $1,805 $92,300 $11,400 $80,900
2018 $1,784 $90,900 $11,400 $79,500
2017 $1,679 $80,100 $11,400 $68,700
2016 $1,479 $72,600 $11,400 $61,200
2015 $1,437 $66,900 $11,400 $55,500
2014 $1,358 $63,700 $11,400 $52,300
Source: Public Records

Agents Affiliated with this Home

  • Section Image
See All Agents

Map