Estimated Value: $630,882 - $636,000
3
Beds
3
Baths
2,363
Sq Ft
$268/Sq Ft
Est. Value
About This Home
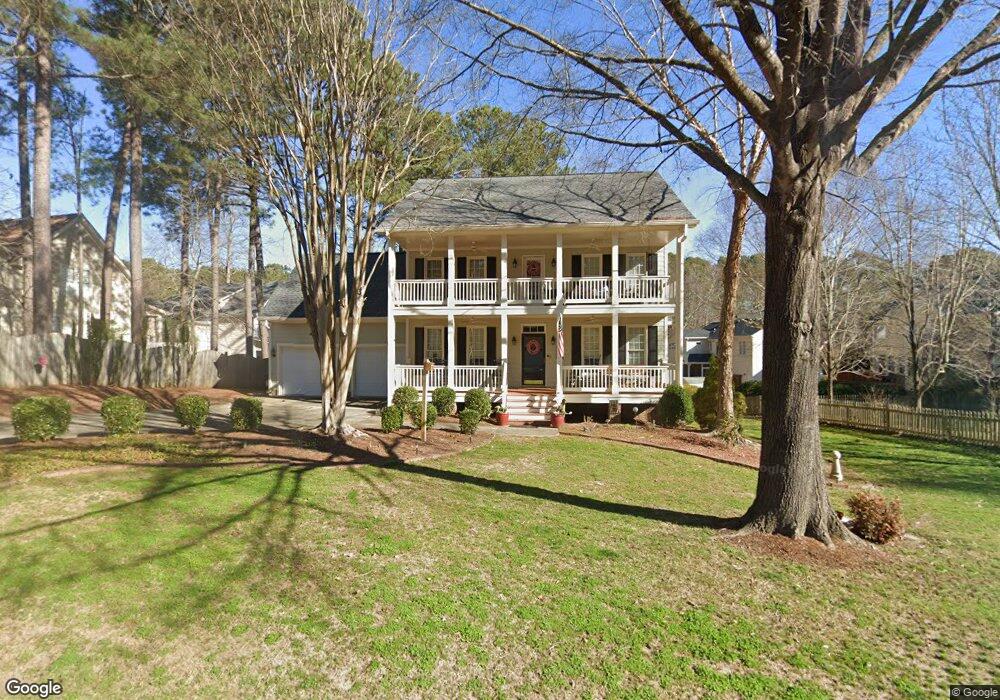
This home is located at 305 Hickory View Ln, Apex, NC 27502 and is currently estimated at $633,471, approximately $268 per square foot. 305 Hickory View Ln is a home located in Wake County with nearby schools including Scotts Ridge Elementary School, Apex Middle, and Apex High School.
Ownership History
Date
Name
Owned For
Owner Type
Purchase Details
Closed on
Mar 17, 2017
Sold by
Bolebruch Mark J
Bought by
Bolebruch Denise D
Current Estimated Value
Home Financials for this Owner
Home Financials are based on the most recent Mortgage that was taken out on this home.
Original Mortgage
$284,000
Outstanding Balance
$235,639
Interest Rate
4.19%
Mortgage Type
New Conventional
Estimated Equity
$397,832
Purchase Details
Closed on
Sep 21, 2001
Sold by
Abreu Abraham A and Abreau Emma L
Bought by
Bolebruch Mark J and Bolebruch Denise D
Home Financials for this Owner
Home Financials are based on the most recent Mortgage that was taken out on this home.
Original Mortgage
$274,000
Interest Rate
6.97%
Purchase Details
Closed on
Oct 29, 1999
Sold by
Hoke Eric
Bought by
Abreu Abraham A and Abreu Emma L
Home Financials for this Owner
Home Financials are based on the most recent Mortgage that was taken out on this home.
Original Mortgage
$208,648
Interest Rate
6.87%
Create a Home Valuation Report for This Property
The Home Valuation Report is an in-depth analysis detailing your home's value as well as a comparison with similar homes in the area
Purchase History
| Date | Buyer | Sale Price | Title Company |
|---|---|---|---|
| Bolebruch Denise D | -- | Timios Inc | |
| Bolebruch Mark J | $270,000 | -- | |
| Abreu Abraham A | $261,000 | -- |
Source: Public Records
Mortgage History
| Date | Status | Borrower | Loan Amount |
|---|---|---|---|
| Open | Bolebruch Denise D | $284,000 | |
| Closed | Bolebruch Mark J | $274,000 | |
| Previous Owner | Abreu Abraham A | $208,648 |
Source: Public Records
Tax History
| Year | Tax Paid | Tax Assessment Tax Assessment Total Assessment is a certain percentage of the fair market value that is determined by local assessors to be the total taxable value of land and additions on the property. | Land | Improvement |
|---|---|---|---|---|
| 2025 | $5,395 | $615,669 | $189,000 | $426,669 |
| 2024 | $5,275 | $615,669 | $189,000 | $426,669 |
Source: Public Records
Map
Nearby Homes
- 107 Maple Crest Ct
- 113 Curley Maple Ct
- 205 Pine Mill Ln
- 400 Village Loop Dr
- 1224 Tartarian Trail
- 1050 Scotts Ridge Trail
- 1118 Scotts Ridge Trail
- 1216 Scotts Ridge Trail
- 440 Oak Pine Dr
- 1314 Chenworth Dr
- 517 Village Loop Dr
- 1020 Bungalow Park Dr
- 470 Magdala Place
- 1047 Mica Lamp Ct
- 809 Town Side Dr
- 1305 Olde Walker Mill Rd
- 3013 White Cloud Cir
- 3021 White Cloud Cir
- 1913 Metta Mill Ln
- 2002 Kelly Glen Dr
- 400 Timber Cut Ln
- 404 Timber Cut Ln
- 102 Maple Crest Ct
- 309 Hickory View Ln
- 408 Timber Cut Ln
- 104 Maple Crest Ct
- 302 Hickory View Ln
- 304 Hickory View Ln
- 300 Hickory View Ln
- 412 Timber Cut Ln
- 50 Hickory View Ln
- 306 Hickory View Ln
- 106 Maple Crest Ct
- 308 Hickory View Ln
- 401 Timber Cut Ln
- 401 Hickory View Ln
- 512 Scotts Ridge Trail
- 400 Hickory View Ln
- 405 Timber Cut Ln
- 416 Timber Cut Ln
Your Personal Tour Guide
Ask me questions while you tour the home.