Estimated Value: $437,000 - $543,000
3
Beds
4
Baths
2,548
Sq Ft
$196/Sq Ft
Est. Value
About This Home
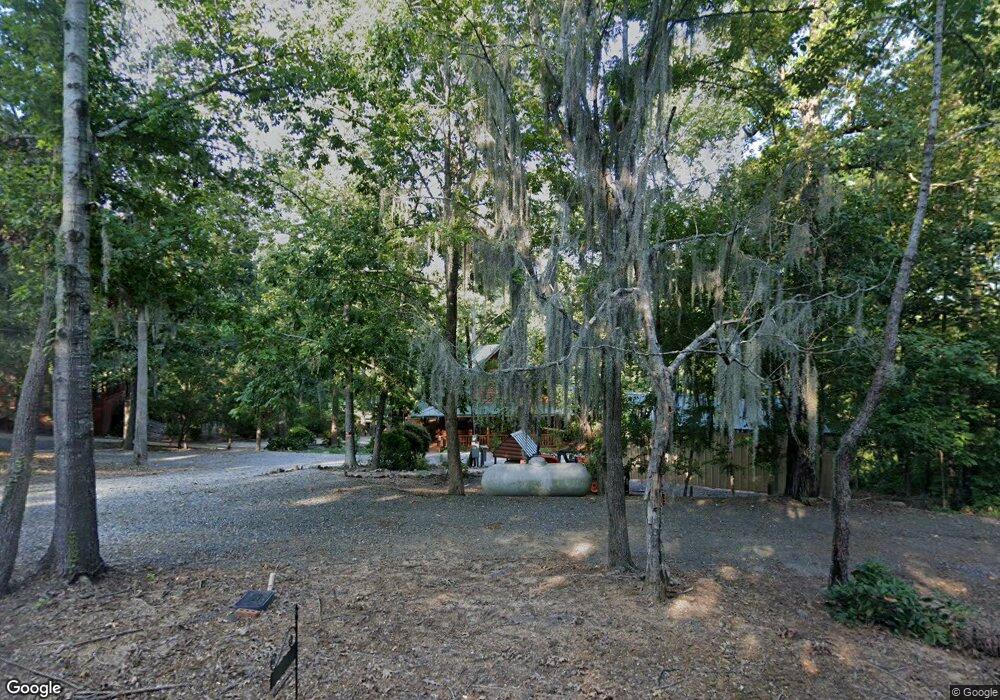
This home is located at 305 Joe Dr, Many, LA 71449 and is currently estimated at $498,411, approximately $195 per square foot. 305 Joe Dr is a home located in Sabine Parish with nearby schools including Negreet High School.
Ownership History
Date
Name
Owned For
Owner Type
Purchase Details
Closed on
Jun 3, 2025
Sold by
Hilton Thomas Dale and Hilton Sandra Kaye
Bought by
Circle Star H Properties Llc
Current Estimated Value
Purchase Details
Closed on
Oct 21, 2013
Sold by
Federal Home Loan Mortgage Corporation
Bought by
Hilton Thomas Dale and Hilton Sandra Kaye
Purchase Details
Closed on
Mar 25, 2013
Sold by
Cenlar Fsb
Bought by
Federal Home Loan Mortgage Corporation
Purchase Details
Closed on
Mar 11, 2013
Sold by
Wise Jerry W and Wise Carolyn J
Bought by
Cenlar Fsb
Purchase Details
Closed on
Sep 25, 2008
Sold by
Smith Bennon R and Smith Martha B
Bought by
Wise Jerry W and Wise Carolyn J
Home Financials for this Owner
Home Financials are based on the most recent Mortgage that was taken out on this home.
Original Mortgage
$329,650
Interest Rate
6.46%
Mortgage Type
New Conventional
Create a Home Valuation Report for This Property
The Home Valuation Report is an in-depth analysis detailing your home's value as well as a comparison with similar homes in the area
Purchase History
| Date | Buyer | Sale Price | Title Company |
|---|---|---|---|
| Circle Star H Properties Llc | $282,447 | None Listed On Document | |
| Circle Star H Properties Llc | $282,447 | None Listed On Document | |
| Hilton Thomas Dale | $254,000 | None Available | |
| Federal Home Loan Mortgage Corporation | $200,000 | None Available | |
| Cenlar Fsb | $200,000 | None Available | |
| Wise Jerry W | $347,000 | None Available |
Source: Public Records
Mortgage History
| Date | Status | Borrower | Loan Amount |
|---|---|---|---|
| Previous Owner | Wise Jerry W | $329,650 |
Source: Public Records
Tax History
| Year | Tax Paid | Tax Assessment Tax Assessment Total Assessment is a certain percentage of the fair market value that is determined by local assessors to be the total taxable value of land and additions on the property. | Land | Improvement |
|---|---|---|---|---|
| 2025 | $2,685 | $39,826 | $5,825 | $34,001 |
| 2024 | $2,426 | $39,826 | $5,825 | $34,001 |
| 2023 | $1,529 | $24,605 | $4,568 | $20,037 |
| 2022 | $1,529 | $24,605 | $4,568 | $20,037 |
| 2021 | $1,684 | $24,605 | $4,568 | $20,037 |
| 2020 | $1,685 | $24,605 | $4,568 | $20,037 |
| 2019 | $1,681 | $24,605 | $4,568 | $20,037 |
| 2018 | $1,322 | $19,210 | $1,490 | $17,720 |
| 2017 | $1,538 | $19,210 | $1,490 | $17,720 |
| 2016 | $1,568 | $19,210 | $1,490 | $17,720 |
| 2015 | $1,641 | $19,210 | $1,490 | $17,720 |
| 2014 | -- | $19,210 | $1,490 | $17,720 |
Source: Public Records
Map
Nearby Homes
Your Personal Tour Guide
Ask me questions while you tour the home.