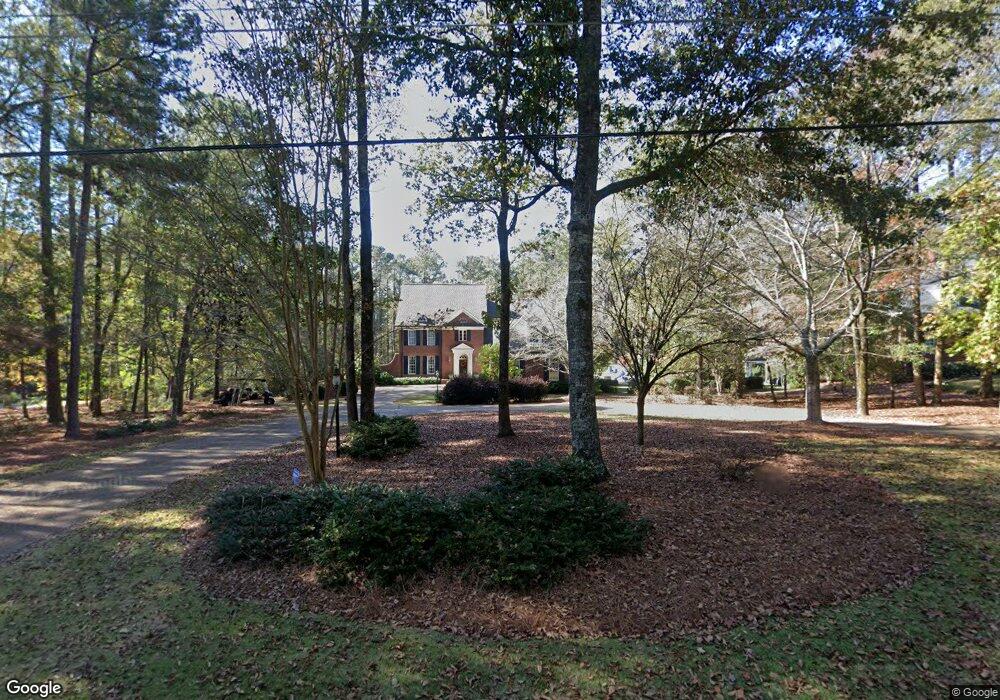
305 Lakeshore Dr Lagrange, GA 30240
Estimated Value: $614,000 - $1,428,000
4
Beds
6
Baths
4,227
Sq Ft
$276/Sq Ft
Est. Value
About This Home
This home is located at 305 Lakeshore Dr, Lagrange, GA 30240 and is currently estimated at $1,166,433, approximately $275 per square foot. 305 Lakeshore Dr is a home located in Troup County with nearby schools including Hollis Hand Elementary School, Ethel W. Kight Elementary School, and Franklin Forest Elementary School.
Ownership History
Date
Name
Owned For
Owner Type
Purchase Details
Closed on
Feb 2, 2009
Sold by
Ring David J
Bought by
Hollstrom Richard P
Current Estimated Value
Home Financials for this Owner
Home Financials are based on the most recent Mortgage that was taken out on this home.
Original Mortgage
$902,500
Outstanding Balance
$569,878
Interest Rate
5.08%
Mortgage Type
New Conventional
Estimated Equity
$596,555
Purchase Details
Closed on
Mar 1, 2006
Sold by
Anderson Martha F
Bought by
Ring David J and Ring Dawn L
Purchase Details
Closed on
Feb 26, 2002
Sold by
Broadwater Development Corp
Bought by
Kevin Martha F and Kevin Murp
Purchase Details
Closed on
Feb 25, 2002
Sold by
Mcrae Frank W and Mcrae Elizabeth F
Bought by
Broadwater Development Corp
Purchase Details
Closed on
May 19, 1999
Sold by
Ida Cason Callaway Hudson
Bought by
Mcrae Frank W and Mcrae Elizabeth F
Purchase Details
Closed on
Aug 12, 1998
Sold by
Callaway Fuller Est
Bought by
Ida Cason Callaway Hudson
Create a Home Valuation Report for This Property
The Home Valuation Report is an in-depth analysis detailing your home's value as well as a comparison with similar homes in the area
Home Values in the Area
Average Home Value in this Area
Purchase History
| Date | Buyer | Sale Price | Title Company |
|---|---|---|---|
| Hollstrom Richard P | $950,000 | -- | |
| Hollstrom Richard P | $950,000 | -- | |
| Ring David J | $815,000 | -- | |
| Kevin Martha F | $798,300 | -- | |
| Broadwater Development Corp | $110,000 | -- | |
| Mcrae Frank W | $85,000 | -- | |
| Ida Cason Callaway Hudson | -- | -- |
Source: Public Records
Mortgage History
| Date | Status | Borrower | Loan Amount |
|---|---|---|---|
| Open | Hollstrom Richard P | $902,500 | |
| Closed | Hollstrom Richard P | $902,500 |
Source: Public Records
Tax History Compared to Growth
Tax History
| Year | Tax Paid | Tax Assessment Tax Assessment Total Assessment is a certain percentage of the fair market value that is determined by local assessors to be the total taxable value of land and additions on the property. | Land | Improvement |
|---|---|---|---|---|
| 2024 | $13,319 | $490,360 | $67,480 | $422,880 |
| 2023 | $11,933 | $439,520 | $54,000 | $385,520 |
| 2022 | $11,504 | $414,160 | $54,000 | $360,160 |
| 2021 | $12,491 | $416,160 | $54,000 | $362,160 |
| 2020 | $12,491 | $416,160 | $54,000 | $362,160 |
| 2019 | $12,495 | $416,280 | $54,000 | $362,280 |
| 2018 | $12,367 | $412,040 | $54,000 | $358,040 |
| 2017 | $12,548 | $418,040 | $60,000 | $358,040 |
| 2016 | $12,224 | $407,302 | $60,000 | $347,302 |
| 2015 | $12,245 | $407,302 | $60,000 | $347,302 |
| 2014 | $9,527 | $316,804 | $60,000 | $256,804 |
| 2013 | -- | $319,046 | $60,000 | $259,046 |
Source: Public Records
Map
Nearby Homes
- 106 Highland Park
- 116 Deal Dr
- 114 Millridge Dr
- 101 Deal Dr
- 654 Cameron Mill Rd
- 105 Ridgeview Dr
- 203 S Chilton Crescent
- 201 S Chilton Crescent
- 104 Sweetgum Dr
- 603 Country Club Rd
- 129 Sunny Point Cir
- 127 Ashling Dr
- 100 Creekside Dr Unit LOT 60A
- 748 Lakewood Dr
- 106 S Chilton Crescent
- 107 Dixie Creek Dr
- 117 Woodchase
- 118 Moss Creek Dr
- 724 Camellia Dr
- 104 Hidden Branches Ln
- 307 Lakeshore Dr
- 301 Lakeshore Dr
- 304 Lakeshore Dr Unit LOT 26
- 309 Lakeshore Dr
- 100 Highland Park
- 308 Lakeshore Dr
- 102 Highland Park
- 416 Highland Park
- 310 Lakeshore Dr
- 414 Highland Park
- 312 Lakeshore Dr Unit 30
- 315 Lakeshore Dr
- 104-106 Highland Park
- 122 Highland Park
- 124 Highland Park
- 412 Highland Park
- 317 Lakeshore Dr
- 410 Highland Park
- 314 Lakeshore Dr Unit LOT 31
- 314 Lakeshore Dr