Estimated Value: $167,170 - $219,000
--
Bed
--
Bath
1,104
Sq Ft
$177/Sq Ft
Est. Value
About This Home
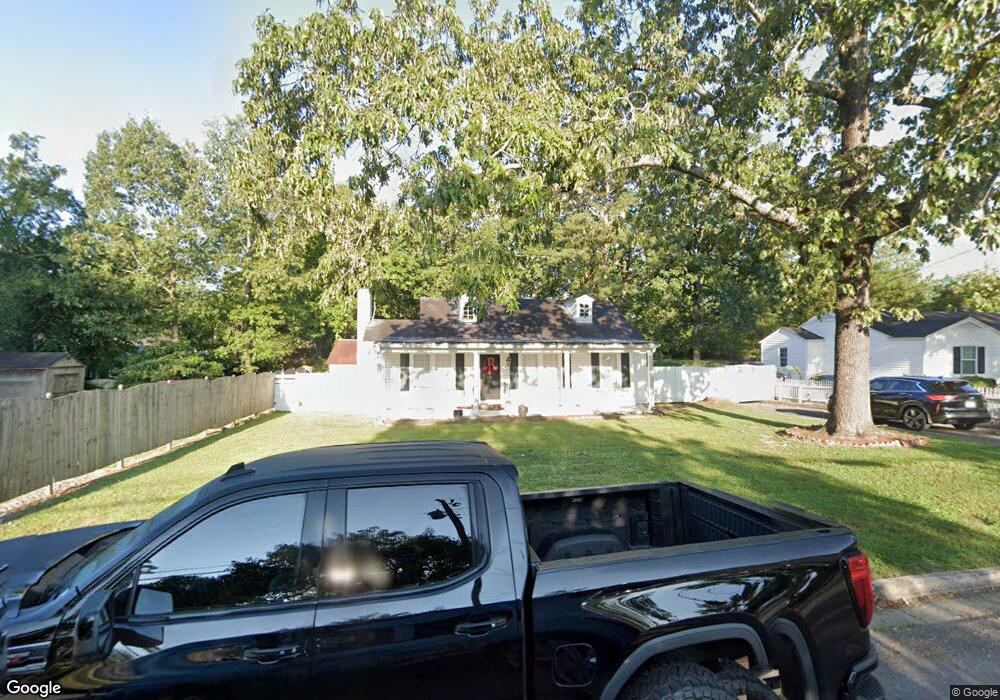
This home is located at 305 Leland Ave NW, Rome, GA 30165 and is currently estimated at $195,793, approximately $177 per square foot. 305 Leland Ave NW is a home located in Floyd County with nearby schools including Rome High School and Unity Christian School.
Ownership History
Date
Name
Owned For
Owner Type
Purchase Details
Closed on
Apr 17, 2000
Sold by
D & D Properties
Bought by
Debra & Diane Properties Llc
Current Estimated Value
Purchase Details
Closed on
May 2, 1997
Sold by
Clotfelter Harold and Nell Clotfelter Miln
Bought by
D & D Properties
Purchase Details
Closed on
Aug 10, 1988
Sold by
Reeves David Alan and Garrard Candice V
Bought by
Clotfelter Harold and Nell Clotfelter
Purchase Details
Closed on
Mar 29, 1984
Sold by
Mcswine Josephine
Bought by
Reeves David Alan and Garra Candice V
Purchase Details
Closed on
Jan 29, 1980
Sold by
Mcswine Griff
Bought by
Mcswine Josephine
Purchase Details
Closed on
Sep 12, 1979
Sold by
Crawford Thomas E
Bought by
Mcswine Griff
Purchase Details
Closed on
Feb 10, 1978
Sold by
Bloom Robert B
Bought by
Crawford Thomas E
Purchase Details
Closed on
May 27, 1974
Sold by
Callaway Ellen H
Bought by
Bloom Robert B
Purchase Details
Closed on
Jul 23, 1970
Sold by
Callaway B J
Bought by
Callaway Ellen H
Purchase Details
Closed on
Jan 1, 1901
Bought by
Callaway B J
Create a Home Valuation Report for This Property
The Home Valuation Report is an in-depth analysis detailing your home's value as well as a comparison with similar homes in the area
Home Values in the Area
Average Home Value in this Area
Purchase History
| Date | Buyer | Sale Price | Title Company |
|---|---|---|---|
| Debra & Diane Properties Llc | -- | -- | |
| D & D Properties | $69,900 | -- | |
| Clotfelter Harold | $8,100 | -- | |
| Reeves David Alan | $41,500 | -- | |
| Mcswine Josephine | $37,500 | -- | |
| Mcswine Griff | $37,500 | -- | |
| Crawford Thomas E | $30,700 | -- | |
| Bloom Robert B | $29,000 | -- | |
| Callaway Ellen H | -- | -- | |
| Callaway B J | -- | -- |
Source: Public Records
Tax History Compared to Growth
Tax History
| Year | Tax Paid | Tax Assessment Tax Assessment Total Assessment is a certain percentage of the fair market value that is determined by local assessors to be the total taxable value of land and additions on the property. | Land | Improvement |
|---|---|---|---|---|
| 2024 | $2,807 | $73,260 | $16,456 | $56,804 |
| 2023 | $2,594 | $61,748 | $14,960 | $46,788 |
| 2022 | $2,502 | $68,553 | $12,342 | $56,211 |
| 2021 | $2,348 | $63,272 | $12,342 | $50,930 |
| 2020 | $2,166 | $57,890 | $9,350 | $48,540 |
| 2019 | $1,948 | $52,626 | $9,350 | $43,276 |
| 2018 | $1,860 | $50,241 | $9,350 | $40,891 |
| 2017 | $1,814 | $48,997 | $9,350 | $39,647 |
| 2016 | $1,798 | $48,418 | $9,320 | $39,098 |
| 2015 | $1,698 | $48,418 | $9,320 | $39,098 |
| 2014 | $1,698 | $48,418 | $9,320 | $39,098 |
Source: Public Records
Map
Nearby Homes
- 208 Dodd St NW
- 105 Robin St NW
- 7 Raymond Ave NW
- 204 Oakwood St NW
- 4 Colonial Dr NW
- 614 Briarwood Cir NW
- 0 Unbridled Rd Unit 22 23074684
- 808 Charlton St NW
- 1005 N 2nd Ave NW Unit 39
- PEARSON Plan at Shorter Village
- 527 W 11th St NE
- 9 Shorter Cir SW
- 209 Sherwood Rd SW
- 124 Sheridan Dr NW
- 601 W 10th St NE
- 23 Sweetspire Dr NW
- 21 Sweetspire Dr NW
- 15 Silverbell Ln
- 303 Leland Ave NW
- 102 Dodd St NW
- 100 Dodd St NW
- 104 Dodd St NW
- 106 Dodd St NW
- 103 Redmond Rd NW
- 101 Redmond Rd NW
- 302 Raymond Ave NW
- 302 Raymond Ave NW Unit 7
- 304 Raymond Ave NW
- 108 Dodd St NW
- 105 Redmond Rd
- 107 Redmond Rd
- 300 Leland Ave NW
- 300 Leland Ave NW Unit 26
- 110 Dodd St NW
- 101 Dodd St NW
- 105 Dodd St NW
- 212 & 212 1 2 Leland Ave
- 107 Dodd St NW