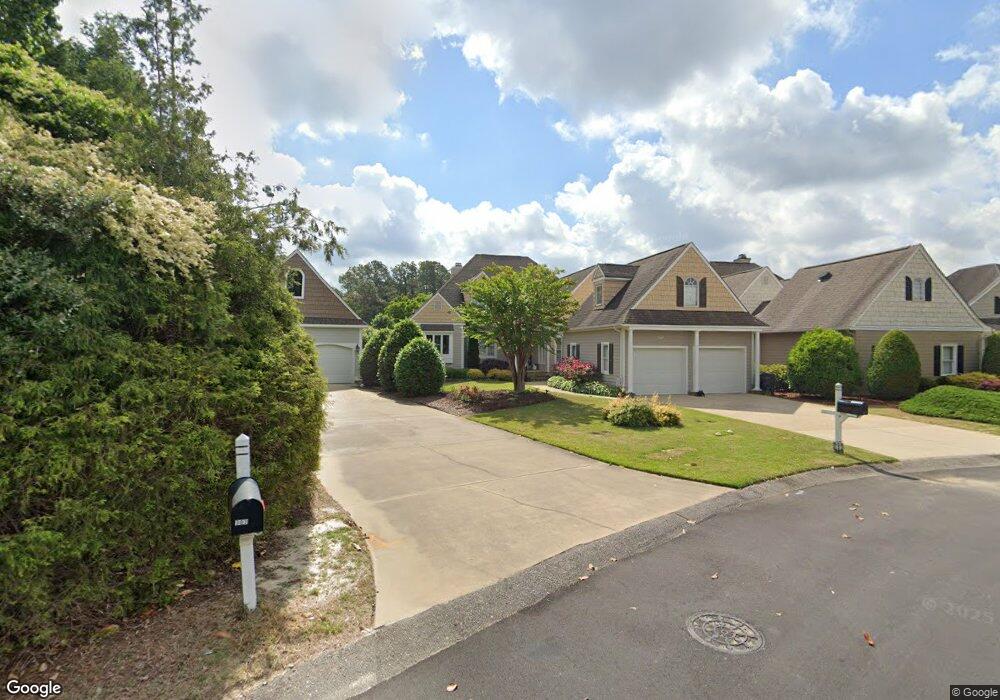
305 Magnolia Cir Southern Pines, NC 28387
Estimated Value: $523,538 - $693,000
3
Beds
2
Baths
2,148
Sq Ft
$273/Sq Ft
Est. Value
About This Home
This home is located at 305 Magnolia Cir, Southern Pines, NC 28387 and is currently estimated at $586,385, approximately $272 per square foot. 305 Magnolia Cir is a home located in Moore County with nearby schools including Southern Pines Elementary, Southern Middle School, and Pinecrest High School.
Ownership History
Date
Name
Owned For
Owner Type
Purchase Details
Closed on
Oct 8, 2020
Sold by
Evans Charles Leroy and Evans Nancy Herzog
Bought by
Hecht Lisa Peele
Current Estimated Value
Home Financials for this Owner
Home Financials are based on the most recent Mortgage that was taken out on this home.
Original Mortgage
$264,000
Outstanding Balance
$234,814
Interest Rate
2.9%
Mortgage Type
New Conventional
Estimated Equity
$351,571
Purchase Details
Closed on
May 9, 2019
Sold by
Herzog Evans Charles Leroy and Herzog Evans Nancy
Bought by
Charles Evans And Nancy Evans Liv Tr
Purchase Details
Closed on
May 26, 2006
Sold by
Ebright James R and Ebright Barbara K
Bought by
Evans Charles L and Evans Nancy H
Purchase Details
Closed on
May 15, 2002
Sold by
Ebright James R and Ebright Barbara
Bought by
Evans Charles L and Evans Nancy H
Create a Home Valuation Report for This Property
The Home Valuation Report is an in-depth analysis detailing your home's value as well as a comparison with similar homes in the area
Home Values in the Area
Average Home Value in this Area
Purchase History
| Date | Buyer | Sale Price | Title Company |
|---|---|---|---|
| Hecht Lisa Peele | $330,000 | None Available | |
| Charles Evans And Nancy Evans Liv Tr | -- | None Available | |
| Evans Charles L | $358,000 | None Available | |
| Evans Charles L | $300,000 | -- |
Source: Public Records
Mortgage History
| Date | Status | Borrower | Loan Amount |
|---|---|---|---|
| Open | Hecht Lisa Peele | $264,000 |
Source: Public Records
Tax History Compared to Growth
Tax History
| Year | Tax Paid | Tax Assessment Tax Assessment Total Assessment is a certain percentage of the fair market value that is determined by local assessors to be the total taxable value of land and additions on the property. | Land | Improvement |
|---|---|---|---|---|
| 2024 | $2,846 | $446,480 | $70,000 | $376,480 |
| 2023 | $2,936 | $446,480 | $70,000 | $376,480 |
| 2022 | $3,139 | $339,320 | $55,000 | $284,320 |
| 2021 | $3,224 | $339,320 | $55,000 | $284,320 |
| 2020 | $3,251 | $339,320 | $55,000 | $284,320 |
| 2019 | $3,251 | $339,320 | $55,000 | $284,320 |
| 2018 | $3,136 | $346,520 | $85,000 | $261,520 |
| 2017 | $3,101 | $346,520 | $85,000 | $261,520 |
| 2015 | $2,997 | $346,520 | $85,000 | $261,520 |
| 2014 | -- | $366,160 | $92,000 | $274,160 |
| 2013 | -- | $366,160 | $92,000 | $274,160 |
Source: Public Records
Map
Nearby Homes
- 507 Cottage Ln
- 218 Starland Ln
- 176 Starland Ln
- 85 Station Ave
- 167 Hunter Trail
- 2 Hunter Ct
- 227 N Knoll Rd
- 9 Scots Glen Dr
- 15 Plantation Dr
- 1610 Midland Rd
- 125 Williams Rd
- 2148 Midland Rd
- 183 Gaeta Dr
- 175 N Knoll Rd
- 2145 Midland Rd
- 111 S Bracken Fern Ln
- 205 Sundew Ct
- 732 Burlwood Dr
- 380 N Bracken Fern Ln
- 109 Florence Dr
- 303 Magnolia Cir
- 307 Magnolia Cir
- 309 Magnolia Cir
- 301 Magnolia Cir Unit 1 & 2
- 311 Magnolia Cir
- 313 Magnolia Cir
- 315 Magnolia Cir
- 317 Magnolia Cir
- 319 Magnolia Cir
- 321 Magnolia Cir
- 22 Glen Devon Dr
- 323 Magnolia Cir
- 20 Glen Devon Dr
- 519 Cottage Ln
- 325 Magnolia Cir
- 513 Cottage Ln
- 511 Cottage Ln Unit 511
- 523 Cottage Ln
- 505 Cottage Ln Unit 505
- 521 Cottage Ln