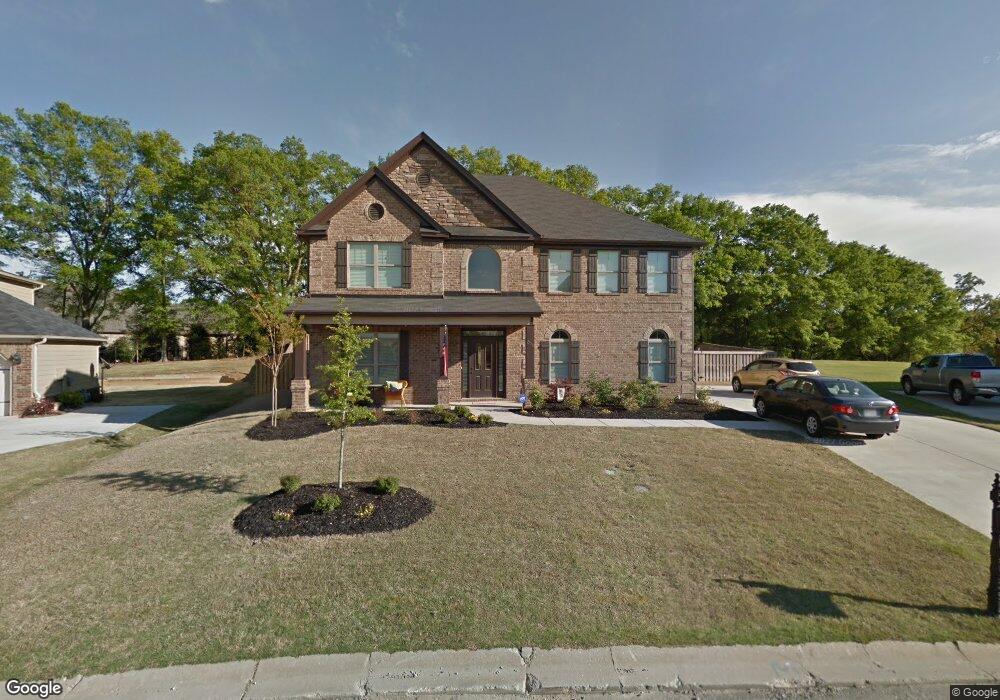
305 Montalcino Way Simpsonville, SC 29681
Estimated Value: $489,251 - $660,000
4
Beds
3
Baths
3,229
Sq Ft
$168/Sq Ft
Est. Value
About This Home
This home is located at 305 Montalcino Way, Simpsonville, SC 29681 and is currently estimated at $543,313, approximately $168 per square foot. 305 Montalcino Way is a home with nearby schools including Bell's Crossing Elementary School, Hillcrest Middle School, and Hillcrest High School.
Ownership History
Date
Name
Owned For
Owner Type
Purchase Details
Closed on
Nov 8, 2024
Sold by
Lane Jamie E
Bought by
Lane Jamie E and Lane Eric S
Current Estimated Value
Purchase Details
Closed on
Dec 8, 2020
Sold by
Slaughter Jamie E
Bought by
Lane Jamie E
Home Financials for this Owner
Home Financials are based on the most recent Mortgage that was taken out on this home.
Original Mortgage
$271,000
Interest Rate
2.7%
Mortgage Type
New Conventional
Purchase Details
Closed on
Sep 26, 2014
Sold by
D R Horton Crown Llc
Bought by
Slaughter Jamie E
Home Financials for this Owner
Home Financials are based on the most recent Mortgage that was taken out on this home.
Original Mortgage
$301,255
Interest Rate
4.17%
Mortgage Type
New Conventional
Purchase Details
Closed on
May 8, 2014
Sold by
S C Pillon Homes Inc
Bought by
D R Horton Crown Llc
Create a Home Valuation Report for This Property
The Home Valuation Report is an in-depth analysis detailing your home's value as well as a comparison with similar homes in the area
Home Values in the Area
Average Home Value in this Area
Purchase History
| Date | Buyer | Sale Price | Title Company |
|---|---|---|---|
| Lane Jamie E | -- | None Listed On Document | |
| Lane Jamie E | -- | None Listed On Document | |
| Lane Jamie E | -- | None Available | |
| Slaughter Jamie E | $317,111 | -- | |
| D R Horton Crown Llc | $5,098,213 | -- |
Source: Public Records
Mortgage History
| Date | Status | Borrower | Loan Amount |
|---|---|---|---|
| Previous Owner | Lane Jamie E | $271,000 | |
| Previous Owner | Slaughter Jamie E | $301,255 |
Source: Public Records
Tax History Compared to Growth
Tax History
| Year | Tax Paid | Tax Assessment Tax Assessment Total Assessment is a certain percentage of the fair market value that is determined by local assessors to be the total taxable value of land and additions on the property. | Land | Improvement |
|---|---|---|---|---|
| 2024 | $1,852 | $11,770 | $2,400 | $9,370 |
| 2023 | $1,852 | $11,770 | $2,400 | $9,370 |
| 2022 | $1,805 | $11,770 | $2,400 | $9,370 |
| 2021 | $1,806 | $11,770 | $2,400 | $9,370 |
| 2020 | $1,857 | $11,550 | $2,200 | $9,350 |
| 2019 | $1,859 | $11,550 | $2,200 | $9,350 |
| 2018 | $1,911 | $11,550 | $2,200 | $9,350 |
| 2017 | $1,913 | $11,550 | $2,200 | $9,350 |
| 2016 | $1,847 | $288,690 | $55,000 | $233,690 |
| 2015 | $1,851 | $288,690 | $55,000 | $233,690 |
| 2014 | $1,932 | $288,690 | $55,000 | $233,690 |
Source: Public Records
Map
Nearby Homes
- 201 Tuscany Falls Dr
- 7 Argent Ct
- 0 Scuffletown Rd
- 47 Caventon Dr
- 2 Glenrock Ln
- 110 Plain Post Trail
- 206 Plain Post Trail
- 208 Plain Post Trail
- 117 Iodine State Beagle Rd
- 307 Oak Valley Dr
- 205 Bergen Ln
- 448 Timberview Ln
- 300 Mckinney Rd
- 1102 Dunwoody Dr
- 355 Leigh Creek Dr
- 503 Lake Lennox Dr
- 200 Horsepen Way
- 111 Autumnwood Way
- 2 Sunray Ln
- 4 Peyton Ln
- 301 Montalcino Way
- 309 Montalcino Way
- 300 Montalcino Way
- 237 Montalcino Way
- 316 Montalcino Way
- 313 Montalcino Way
- 140 Cooper Lake Rd
- 317 Montalcino Way
- 320 Montalcino Way
- 101 Dante Ln
- 232 Montalcino Way
- 321 Montalcino Way
- 32 Dante Ln
- 31 Dante Ln
- 30 Dante Ln
- 29 Dante Ln
- 28 Dante Ln
- 27 Dante Ln
- 26 Dante Ln
- 25 Dante Ln