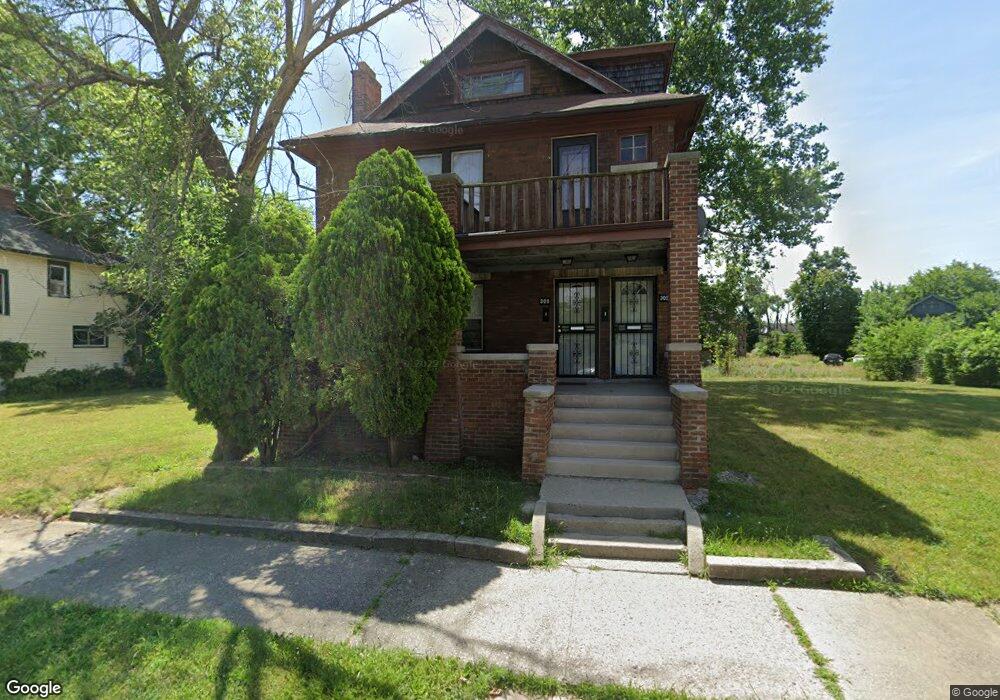
305 Moss St Highland Park, MI 48203
Estimated Value: $141,790 - $212,000
--
Bed
--
Bath
2,600
Sq Ft
$69/Sq Ft
Est. Value
About This Home
This home is located at 305 Moss St, Highland Park, MI 48203 and is currently estimated at $178,948, approximately $68 per square foot. 305 Moss St is a home located in Wayne County with nearby schools including Sigma Academy for Leadership & Early Middle College, George Washington Carver Academy - Middle School, and Charlotte Mason Community School.
Ownership History
Date
Name
Owned For
Owner Type
Purchase Details
Closed on
Apr 4, 2023
Sold by
Michigan Realtoken Vi Llc
Bought by
Realtoken International 305 Moss St Inc
Current Estimated Value
Purchase Details
Closed on
Jan 27, 2023
Sold by
Sled Patrick
Bought by
Michigan Realtoken Iv Llc
Purchase Details
Closed on
Dec 8, 2003
Sold by
The Bank Of New York Trust
Bought by
Sled Patrick
Purchase Details
Closed on
Aug 29, 2002
Sold by
Jenkins Beth R
Bought by
Bank Of New York
Create a Home Valuation Report for This Property
The Home Valuation Report is an in-depth analysis detailing your home's value as well as a comparison with similar homes in the area
Home Values in the Area
Average Home Value in this Area
Purchase History
| Date | Buyer | Sale Price | Title Company |
|---|---|---|---|
| Realtoken International 305 Moss St Inc | $64,000 | Regions Title | |
| Michigan Realtoken Iv Llc | -- | Regions Title | |
| Sled Patrick | $12,500 | Attorneys Title Agency Llc | |
| Bank Of New York | $32,301 | -- |
Source: Public Records
Tax History Compared to Growth
Tax History
| Year | Tax Paid | Tax Assessment Tax Assessment Total Assessment is a certain percentage of the fair market value that is determined by local assessors to be the total taxable value of land and additions on the property. | Land | Improvement |
|---|---|---|---|---|
| 2025 | $3,542 | $53,700 | $0 | $0 |
| 2024 | $3,542 | $48,200 | $0 | $0 |
| 2023 | $1,171 | $43,000 | $0 | $0 |
| 2022 | $1,337 | $33,900 | $0 | $0 |
| 2021 | $1,311 | $23,000 | $0 | $0 |
| 2019 | $1,372 | $16,100 | $0 | $0 |
| 2018 | $1,162 | $13,800 | $0 | $0 |
| 2017 | $436 | $13,800 | $0 | $0 |
| 2016 | $1,601 | $14,700 | $0 | $0 |
| 2015 | $1,810 | $18,100 | $0 | $0 |
| 2013 | $2,580 | $25,800 | $0 | $0 |
| 2012 | $2,352 | $28,000 | $3,600 | $24,400 |
Source: Public Records
Map
Nearby Homes