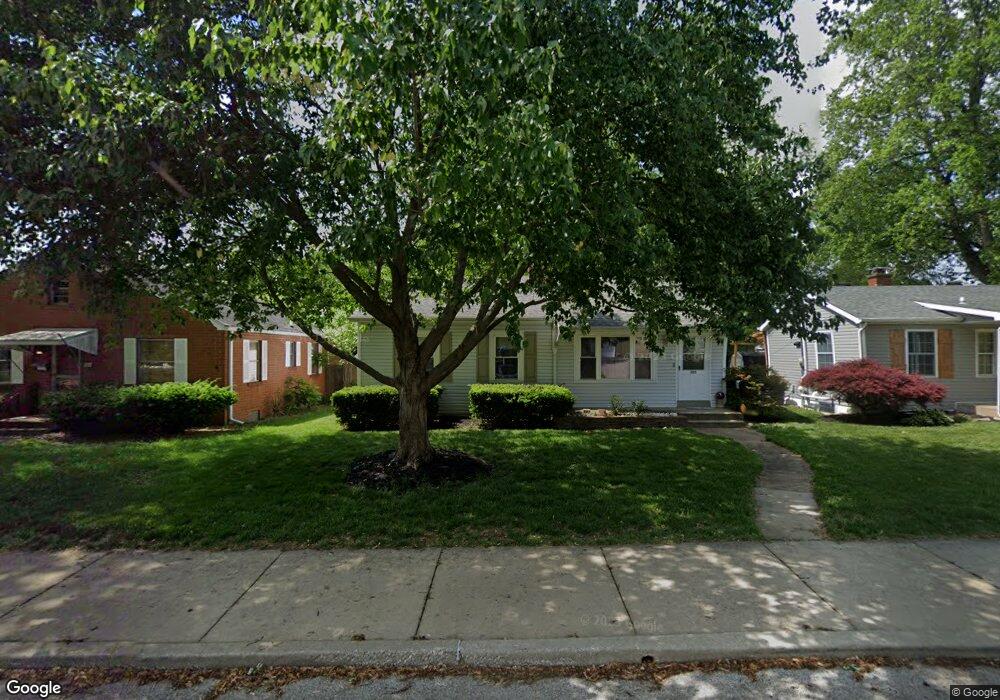
305 N 37th St Belleville, IL 62226
Estimated Value: $91,154 - $147,000
--
Bed
--
Bath
997
Sq Ft
$125/Sq Ft
Est. Value
About This Home
This home is located at 305 N 37th St, Belleville, IL 62226 and is currently estimated at $124,539, approximately $124 per square foot. 305 N 37th St is a home located in St. Clair County with nearby schools including Abraham Lincoln Elementary School, West Jr High School, and Our Lady Queen Of Peace Catholic School.
Ownership History
Date
Name
Owned For
Owner Type
Purchase Details
Closed on
Mar 12, 2015
Sold by
White Steven A and White Janet M
Bought by
White Steven A
Current Estimated Value
Purchase Details
Closed on
May 14, 2003
Sold by
Fayette Daniel K and Fayette Jennifer D
Bought by
Haas Janet M
Home Financials for this Owner
Home Financials are based on the most recent Mortgage that was taken out on this home.
Original Mortgage
$60,000
Outstanding Balance
$26,229
Interest Rate
5.87%
Mortgage Type
Purchase Money Mortgage
Estimated Equity
$98,310
Purchase Details
Closed on
Feb 23, 2001
Sold by
Wagner Michael L and Wagner Jean Vogel
Bought by
Fayette Daniel
Home Financials for this Owner
Home Financials are based on the most recent Mortgage that was taken out on this home.
Original Mortgage
$68,340
Interest Rate
6.91%
Mortgage Type
VA
Create a Home Valuation Report for This Property
The Home Valuation Report is an in-depth analysis detailing your home's value as well as a comparison with similar homes in the area
Home Values in the Area
Average Home Value in this Area
Purchase History
| Date | Buyer | Sale Price | Title Company |
|---|---|---|---|
| White Steven A | -- | None Available | |
| Haas Janet M | $75,000 | Pti | |
| Fayette Daniel | $67,000 | -- |
Source: Public Records
Mortgage History
| Date | Status | Borrower | Loan Amount |
|---|---|---|---|
| Open | Haas Janet M | $60,000 | |
| Previous Owner | Fayette Daniel | $68,340 |
Source: Public Records
Tax History Compared to Growth
Tax History
| Year | Tax Paid | Tax Assessment Tax Assessment Total Assessment is a certain percentage of the fair market value that is determined by local assessors to be the total taxable value of land and additions on the property. | Land | Improvement |
|---|---|---|---|---|
| 2024 | $1,629 | $29,525 | $1,800 | $27,725 |
| 2023 | $1,568 | $27,702 | $1,764 | $25,938 |
| 2022 | $1,334 | $24,939 | $1,588 | $23,351 |
| 2021 | $1,700 | $23,055 | $1,468 | $21,587 |
| 2020 | $1,627 | $21,802 | $1,388 | $20,414 |
| 2019 | $1,494 | $20,425 | $1,391 | $19,034 |
| 2018 | $1,448 | $19,983 | $1,361 | $18,622 |
| 2017 | $1,438 | $19,843 | $1,351 | $18,492 |
| 2016 | $1,414 | $19,421 | $1,322 | $18,099 |
| 2014 | $1,454 | $21,721 | $1,746 | $19,975 |
| 2013 | $1,488 | $22,032 | $1,771 | $20,261 |
Source: Public Records
Map
Nearby Homes