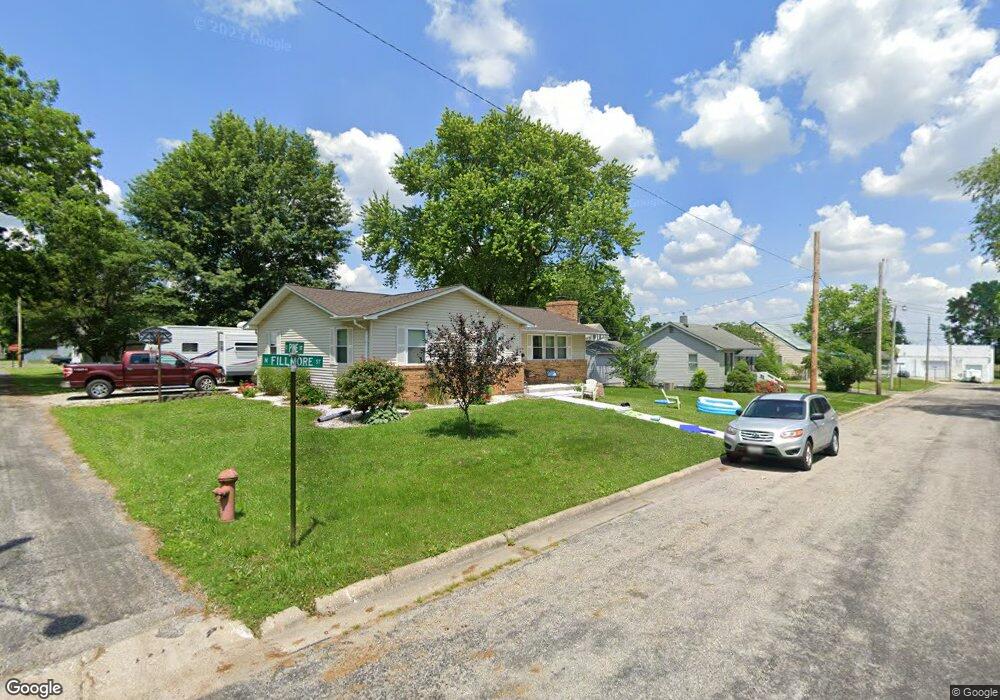
305 N Fillmore St Red Bud, IL 62278
Estimated Value: $161,093 - $217,000
--
Bed
--
Bath
--
Sq Ft
7,405
Sq Ft Lot
About This Home
This home is located at 305 N Fillmore St, Red Bud, IL 62278 and is currently estimated at $190,273. 305 N Fillmore St is a home located in Randolph County with nearby schools including Red Bud Elementary School, Red Bud High School, and St. John the Baptist Catholic School.
Ownership History
Date
Name
Owned For
Owner Type
Purchase Details
Closed on
Apr 2, 2014
Sold by
Junge Mark H
Bought by
Moll Christopher A and Moll Sarah M
Current Estimated Value
Home Financials for this Owner
Home Financials are based on the most recent Mortgage that was taken out on this home.
Original Mortgage
$60,646
Outstanding Balance
$32,363
Interest Rate
4.25%
Mortgage Type
Purchase Money Mortgage
Estimated Equity
$157,910
Purchase Details
Closed on
May 18, 2006
Sold by
Schrader Jeffrey L and Schrader Daw M
Bought by
Junge Mark H
Home Financials for this Owner
Home Financials are based on the most recent Mortgage that was taken out on this home.
Original Mortgage
$109,000
Interest Rate
6.62%
Mortgage Type
Purchase Money Mortgage
Create a Home Valuation Report for This Property
The Home Valuation Report is an in-depth analysis detailing your home's value as well as a comparison with similar homes in the area
Home Values in the Area
Average Home Value in this Area
Purchase History
| Date | Buyer | Sale Price | Title Company |
|---|---|---|---|
| Moll Christopher A | $130,000 | None Available | |
| Junge Mark H | $137,000 | None Available |
Source: Public Records
Mortgage History
| Date | Status | Borrower | Loan Amount |
|---|---|---|---|
| Open | Moll Christopher A | $60,646 | |
| Previous Owner | Junge Mark H | $109,000 |
Source: Public Records
Tax History Compared to Growth
Tax History
| Year | Tax Paid | Tax Assessment Tax Assessment Total Assessment is a certain percentage of the fair market value that is determined by local assessors to be the total taxable value of land and additions on the property. | Land | Improvement |
|---|---|---|---|---|
| 2024 | $2,636 | $50,105 | $6,455 | $43,650 |
| 2023 | $2,446 | $46,915 | $6,045 | $40,870 |
| 2022 | $2,214 | $43,735 | $5,635 | $38,100 |
| 2021 | $2,144 | $41,870 | $5,395 | $36,475 |
| 2020 | $2,188 | $42,892 | $5,529 | $37,363 |
| 2019 | $2,579 | $44,995 | $6,880 | $38,115 |
| 2018 | $2,545 | $49,607 | $7,585 | $42,022 |
| 2017 | $2,447 | $45,045 | $6,585 | $38,460 |
| 2016 | $2,284 | $43,680 | $6,385 | $37,295 |
| 2015 | $2,289 | $43,035 | $6,290 | $36,745 |
| 2014 | $2,289 | $43,995 | $6,430 | $37,565 |
| 2013 | $2,362 | $45,805 | $6,430 | $39,375 |
Source: Public Records
Map
Nearby Homes
- 115 S Taylor St
- 1113 E Market St
- 323 N Main St
- 221 N Main St
- 304 E South 1st St
- 308 S Main St
- 303 E South 3rd St Unit ES
- 254 Charles St
- 304 Country Club Dr
- 985 Powell Rd
- 3554 Russell Dr
- 9668 S Prairie Rd
- 000 Mm Rd
- 0 White Swan Park Unit 32 17096895
- 0 Mm Rd
- 111 W Mill St
- 201 Kaskaskia St
- 370 W Mill St
- 1916 Ames Rd
- Lot 2 E Back St
- 309 N Fillmore St
- 304 Van Buren St
- 217 N Fillmore St
- 308 Van Buren St
- 719 E Pine St
- 304 N Fillmore St
- 310 N Fillmore St
- 220 N Fillmore St
- 311 N Fillmore St
- 212 Van Buren St
- 312 Van Buren St
- 212 N Fillmore St
- 803 Green St
- 307 Van Buren St
- 211 Van Buren St
- 815 High St
- 818 Green St
- 715 E Olive St
- 709 E Olive St
- 815 Green St