305 N Maple St Flushing, MI 48433
Flushing Township AreaEstimated Value: $182,866 - $230,000
About This Home
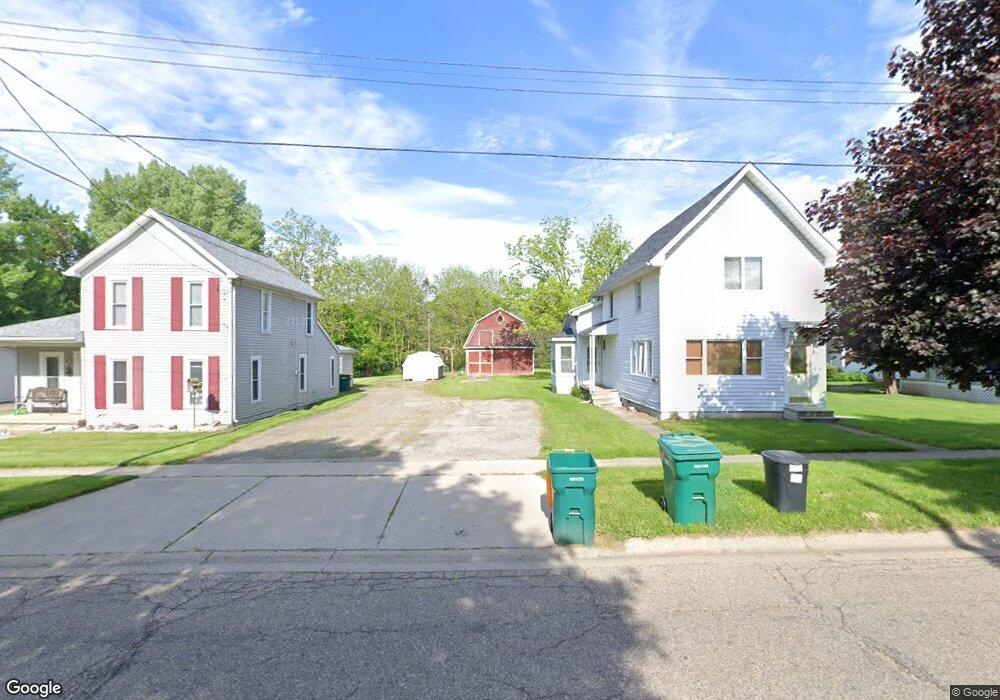
This home is located at 305 N Maple St, Flushing, MI 48433 and is currently estimated at $196,217, approximately $116 per square foot. 305 N Maple St is a home located in Genesee County with nearby schools including Central Elementary School, Flushing Middle School, and Flushing High School.
Ownership History
We collect this data history from publicly available records. To have your information removed, we recommend requesting removal directly through your county’s website.
Purchase Details
Purchase Details
Purchase Details
Purchase Details
Home Values in the Area
Average Home Value in this Area
Purchase History
We collect this data history from publicly available records. To have your information removed, we recommend requesting removal directly through your county’s website.
| Date | Buyer | Sale Price | Title Company |
|---|---|---|---|
| -- | None Listed On Document | ||
| -- | None Listed On Document | ||
| -- | None Available | ||
| -- | None Available |
Tax History
We collect this data history from publicly available records. To have your information removed, we recommend requesting removal directly through your county’s website.
| Year | Tax Paid | Tax Assessment Tax Assessment Total Assessment is a certain percentage of the fair market value that is determined by local assessors to be the total taxable value of land and additions on the property. | Land | Improvement |
|---|---|---|---|---|
| 2025 | $2,004 | $74,600 | $0 | $0 |
| 2024 | $1,937 | $69,200 | $0 | $0 |
| 2023 | $1,864 | $62,000 | $0 | $0 |
| 2022 | $1,940 | $57,800 | $0 | $0 |
| 2021 | $1,940 | $54,500 | $0 | $0 |
| 2020 | $1,650 | $50,800 | $0 | $0 |
| 2019 | $1,622 | $46,000 | $0 | $0 |
| 2018 | $1,786 | $40,400 | $0 | $0 |
| 2017 | $1,702 | $39,700 | $0 | $0 |
| 2016 | $1,688 | $25,158 | $0 | $0 |
| 2015 | $1,680 | $0 | $0 | $0 |
| 2012 | -- | $24,400 | $24,400 | $0 |
Map
- 114 E Henry St
- 324 George St
- 221 N Cherry St
- 111 E Main St
- 225 E Park Ave
- 113 N Mckinley Rd
- 308 Emily St
- 218 S Cherry St
- 0 W Pierson Rd Unit 50141989
- 301 Mill St
- 236 Lynn St
- 308 N Seymour Rd
- 552 N Mckinley Rd
- 588 Oakbrook Cir
- 217 Dutch Mill Dr
- 100 Aberdeen Dr Unit 36
- 100 Aberdeen Dr Unit 36
- 232 Brookside Dr
- 309 Windy Bluff
- 0 E River Rd Unit 50180952
- 301 N Maple St
- 309 N Maple St
- 219 N Maple St
- 103 W Henry St
- 107 W Henry St
- 315 N Maple St Unit 2 Upstairs
- 115 W Henry St
- 215 N Maple St
- 218 George St
- 214 George St
- 108 Mary St
- 106 W Henry St
- 316 N Maple St
- 210 George St
- 306 N Maple St
- 302 N Maple St
- 104 Mary St
- 125 W Henry St
- 310 N Maple St
- 222 N Maple St
Ask me questions while you tour the home.