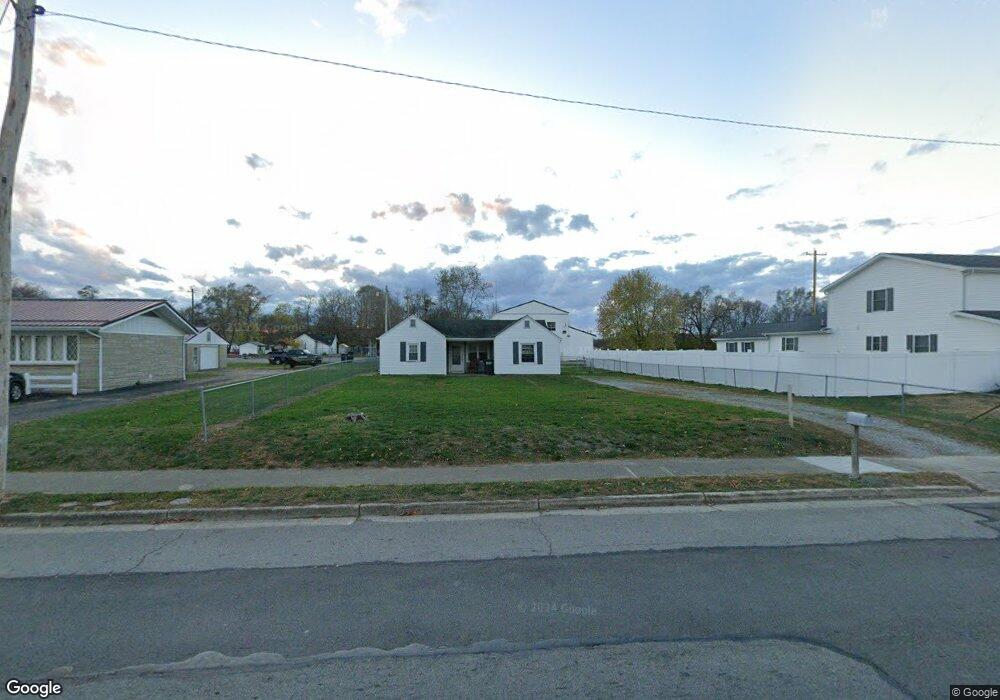
305 N Quarry St Bainbridge, OH 45612
Estimated Value: $110,000 - $139,032
--
Bed
--
Bath
826
Sq Ft
$151/Sq Ft
Est. Value
About This Home
This home is located at 305 N Quarry St, Bainbridge, OH 45612 and is currently estimated at $124,508, approximately $150 per square foot. 305 N Quarry St is a home with nearby schools including Paint Valley Elementary School, Paint Valley Middle School, and Paint Valley High School.
Ownership History
Date
Name
Owned For
Owner Type
Purchase Details
Closed on
Nov 30, 2018
Sold by
Knauff Breanna D
Bought by
Francis Raymond T
Current Estimated Value
Home Financials for this Owner
Home Financials are based on the most recent Mortgage that was taken out on this home.
Original Mortgage
$72,727
Outstanding Balance
$64,074
Interest Rate
4.8%
Mortgage Type
New Conventional
Estimated Equity
$60,434
Purchase Details
Closed on
May 21, 2015
Sold by
Schmidt Lindsay R
Bought by
Knauff Breanna D
Home Financials for this Owner
Home Financials are based on the most recent Mortgage that was taken out on this home.
Original Mortgage
$54,003
Interest Rate
3.62%
Mortgage Type
FHA
Purchase Details
Closed on
Feb 16, 2011
Sold by
Knisley Marcella E and Knisley Larry
Bought by
Schmidt Lindsay R
Home Financials for this Owner
Home Financials are based on the most recent Mortgage that was taken out on this home.
Original Mortgage
$45,600
Interest Rate
4.81%
Mortgage Type
New Conventional
Create a Home Valuation Report for This Property
The Home Valuation Report is an in-depth analysis detailing your home's value as well as a comparison with similar homes in the area
Home Values in the Area
Average Home Value in this Area
Purchase History
| Date | Buyer | Sale Price | Title Company |
|---|---|---|---|
| Francis Raymond T | $72,000 | None Available | |
| Knauff Breanna D | $55,000 | Arrow Title | |
| Schmidt Lindsay R | $48,000 | Attorney |
Source: Public Records
Mortgage History
| Date | Status | Borrower | Loan Amount |
|---|---|---|---|
| Open | Francis Raymond T | $72,727 | |
| Previous Owner | Knauff Breanna D | $54,003 | |
| Previous Owner | Schmidt Lindsay R | $45,600 |
Source: Public Records
Tax History Compared to Growth
Tax History
| Year | Tax Paid | Tax Assessment Tax Assessment Total Assessment is a certain percentage of the fair market value that is determined by local assessors to be the total taxable value of land and additions on the property. | Land | Improvement |
|---|---|---|---|---|
| 2024 | $664 | $16,360 | $3,930 | $12,430 |
| 2023 | $664 | $16,360 | $3,930 | $12,430 |
| 2022 | $667 | $16,360 | $3,930 | $12,430 |
| 2021 | $578 | $12,880 | $3,090 | $9,790 |
| 2020 | $578 | $12,880 | $3,090 | $9,790 |
| 2019 | $587 | $12,880 | $3,090 | $9,790 |
| 2018 | $494 | $10,960 | $2,680 | $8,280 |
| 2017 | $495 | $10,960 | $2,680 | $8,280 |
| 2016 | $484 | $10,960 | $2,680 | $8,280 |
| 2015 | $518 | $11,650 | $2,680 | $8,970 |
| 2014 | $493 | $11,650 | $2,680 | $8,970 |
| 2013 | $501 | $11,650 | $2,680 | $8,970 |
Source: Public Records
Map
Nearby Homes
- 301 N Maple St
- 201 N Maple St
- 316 S Maple St
- 2780 Potts Hill Rd
- 2780 Potts Hill Rd Unit (Tract 4 at Potts Hi
- 213 S Benner Hill Rd
- 1540 Cove Run Rd
- 2470 Tong Hollow Rd
- 0 Schmidt Rd
- 4511 Potts Hill
- 4511 Potts Hill Rd
- 4945 Upper Twin Rd
- 0 Potts Hill Rd Unit 225030231
- 4999 Auerville Rd
- 0 Upper Twin Rd Unit 5159777
- 0 Upper Twin Rd Unit 225036418
- 7724 Cave Rd
- 14703 Brier Rd
- 7885 Upper Twin Rd
- 2466 Pike Lake Rd
- 303 N Quarry St
- 307 N Quarry St
- 306 N Quarry St
- 308 N Quarry St
- 304 N Quarry St
- 301 N Quarry St
- 302 N Quarry St
- 500 N Quarry St
- 400 N Quarry St
- 207 N Quarry St
- 222 N Mountain St
- 220 N Mountain St
- 216 N Mountain St
- 407 N Quarry St
- 208 N Quarry St
- 102 4th St
- 203 N Quarry St
- 203 N Quarry St
- 203 N Quarry St
- 205 N Quarry St