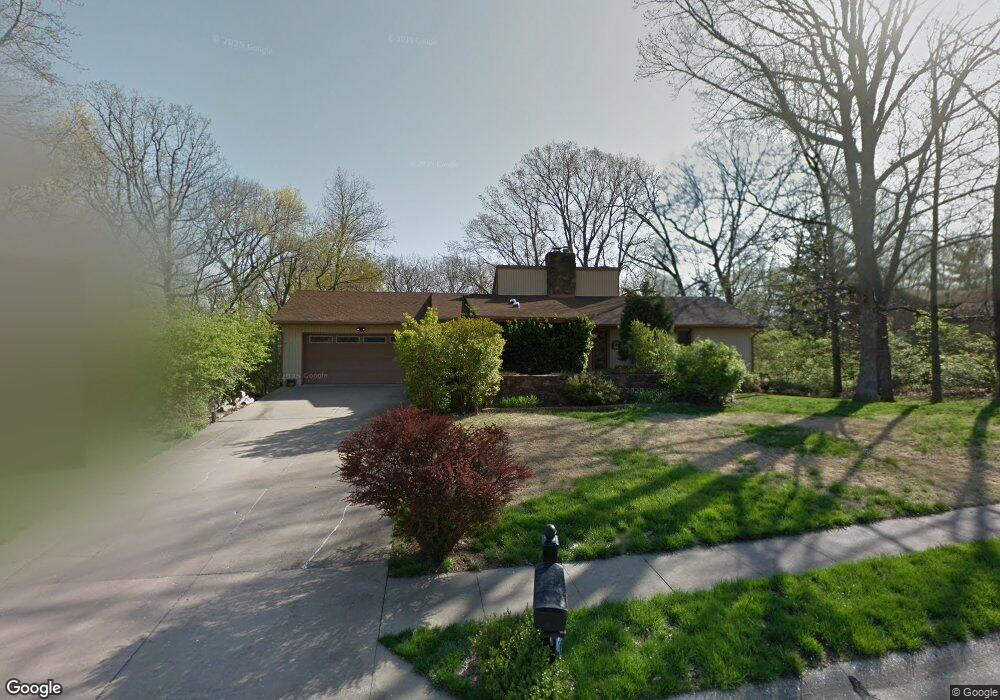
305 Oakridge Ct Columbia, MO 65203
Estimated Value: $419,000 - $548,000
3
Beds
3
Baths
2,662
Sq Ft
$176/Sq Ft
Est. Value
About This Home
This home is located at 305 Oakridge Ct, Columbia, MO 65203 and is currently estimated at $467,728, approximately $175 per square foot. 305 Oakridge Ct is a home located in Boone County with nearby schools including Grant Elementary School, Jefferson Middle School, and Rock Bridge High School.
Ownership History
Date
Name
Owned For
Owner Type
Purchase Details
Closed on
Jul 11, 2022
Sold by
Pamela Kay Anderson Revocable Trust and Anderson Pamela Kay
Bought by
Adams Steven and Adams Rebecca
Current Estimated Value
Home Financials for this Owner
Home Financials are based on the most recent Mortgage that was taken out on this home.
Original Mortgage
$297,000
Outstanding Balance
$282,586
Interest Rate
5.1%
Mortgage Type
Balloon
Estimated Equity
$185,142
Purchase Details
Closed on
Feb 8, 2016
Sold by
Anderson Pamela Kay
Bought by
Anderson Pamela Kay
Home Financials for this Owner
Home Financials are based on the most recent Mortgage that was taken out on this home.
Original Mortgage
$140,900
Interest Rate
3.97%
Mortgage Type
New Conventional
Purchase Details
Closed on
Mar 26, 2015
Sold by
Anderson Pamela K
Bought by
Anderson Pamela Kay and Pamela Kay Anderson Revocable Trust
Create a Home Valuation Report for This Property
The Home Valuation Report is an in-depth analysis detailing your home's value as well as a comparison with similar homes in the area
Purchase History
| Date | Buyer | Sale Price | Title Company |
|---|---|---|---|
| Adams Steven | -- | None Listed On Document | |
| Adams Steven | -- | None Listed On Document | |
| Anderson Pamela Kay | -- | None Available | |
| Anderson Pamela Kay | -- | None Available | |
| Anderson Pamela Kay | -- | None Available |
Source: Public Records
Mortgage History
| Date | Status | Borrower | Loan Amount |
|---|---|---|---|
| Open | Adams Steven | $297,000 | |
| Closed | Adams Steven | $297,000 | |
| Previous Owner | Anderson Pamela Kay | $140,900 |
Source: Public Records
Tax History
| Year | Tax Paid | Tax Assessment Tax Assessment Total Assessment is a certain percentage of the fair market value that is determined by local assessors to be the total taxable value of land and additions on the property. | Land | Improvement |
|---|---|---|---|---|
| 2025 | $4,286 | $65,455 | $5,586 | $59,869 |
| 2024 | $3,857 | $57,171 | $5,586 | $51,585 |
| 2023 | $3,825 | $57,171 | $5,586 | $51,585 |
| 2022 | $2,820 | $42,199 | $5,586 | $36,613 |
| 2021 | $2,826 | $42,199 | $5,586 | $36,613 |
| 2020 | $2,784 | $39,069 | $5,586 | $33,483 |
| 2019 | $2,784 | $39,069 | $5,586 | $33,483 |
| 2018 | $2,596 | $0 | $0 | $0 |
| 2017 | $2,565 | $36,176 | $5,586 | $30,590 |
| 2016 | $2,632 | $36,176 | $5,586 | $30,590 |
| 2015 | $2,428 | $36,176 | $5,586 | $30,590 |
| 2014 | $2,442 | $36,176 | $5,586 | $30,590 |
Source: Public Records
Map
Nearby Homes
- 2816 Melody Ln Unit 21
- 3208 Lynnwood Dr
- 20 Green Meadows Rd
- 3509 Danvers Dr
- 1004 Rollingwood Dr
- 2615 Burrwood Dr
- 2508 Boulder Springs Ct
- 3113 Shoreside Dr
- 1104 Lacosta Ct
- 3809 Wakefield Dr
- 3808 Barrington Dr
- 1107 Vintage Dr
- 3711 Shadow Glen Ct
- 3404 Woodrail Terrace
- 3405 Woodrail Terrace
- 500 Sudbury Dr
- 2111 Rock Quarry Rd
- LOT 101 Clear Creek Estates
- LOT 128 Clear Creek Estates
- LOT 136 Clear Creek Estates
- 309 Oakridge Ct
- LOT 36 Greenbriar Dr
- 301 Oakridge Ct
- 2713 Greenbriar Dr
- 304 Oakridge Ct
- L 252 Oakridge Ct
- L 215 Oakridge Ct
- L 121 Oakridge Ct
- L 113 Oakridge Ct
- L 142-3 Oakridge Ct
- 308 Oakridge Ct
- 2709 Greenbriar Dr
- 300 Oakridge Ct
- 2705 Greenbriar Dr
- 312 Oakridge Ct
- 316 Oakridge Ct
- 2714 Greenbriar Dr
- 2712 Greenbriar Dr
- 2710 Greenbriar Dr
- 2801 Greenbriar Dr
Your Personal Tour Guide
Ask me questions while you tour the home.