305 Okeechobee Rd Wilmington, NC 28412
Lords Creek NeighborhoodEstimated Value: $391,000 - $442,000
3
Beds
2
Baths
1,475
Sq Ft
$276/Sq Ft
Est. Value
About This Home
This home is located at 305 Okeechobee Rd, Wilmington, NC 28412 and is currently estimated at $407,773, approximately $276 per square foot. 305 Okeechobee Rd is a home located in New Hanover County with nearby schools including Edwin A. Anderson Elementary School, Charles P. Murray Middle School, and Eugene Ashley High School.
Ownership History
Date
Name
Owned For
Owner Type
Purchase Details
Closed on
Feb 24, 2007
Sold by
Bollinger Debra M
Bought by
Bollinger Michael T
Current Estimated Value
Purchase Details
Closed on
Mar 8, 2005
Sold by
Singer Ahmed G and Singer Cynthia A
Bought by
Bollinger Michael T and Bollinger Debra M
Home Financials for this Owner
Home Financials are based on the most recent Mortgage that was taken out on this home.
Original Mortgage
$165,000
Interest Rate
5.6%
Mortgage Type
Purchase Money Mortgage
Purchase Details
Closed on
Nov 15, 1999
Sold by
Belote David U
Bought by
Singer Ahmed G Cynthia A
Purchase Details
Closed on
Jul 1, 1996
Sold by
Moore Coy D Susan B
Bought by
Belote David U
Purchase Details
Closed on
May 1, 1985
Sold by
Ocean Forest Lakes Assoc
Bought by
Moore Coy D Susan B
Purchase Details
Closed on
Nov 1, 1984
Bought by
Ocean Forest Lakes Assoc
Create a Home Valuation Report for This Property
The Home Valuation Report is an in-depth analysis detailing your home's value as well as a comparison with similar homes in the area
Home Values in the Area
Average Home Value in this Area
Purchase History
| Date | Buyer | Sale Price | Title Company |
|---|---|---|---|
| Bollinger Michael T | -- | None Available | |
| Bollinger Michael T | $165,000 | None Available | |
| Singer Ahmed G Cynthia A | $134,500 | -- | |
| Belote David U | $17,000 | -- | |
| Moore Coy D Susan B | $15,000 | -- | |
| Ocean Forest Lakes Assoc | -- | -- |
Source: Public Records
Mortgage History
| Date | Status | Borrower | Loan Amount |
|---|---|---|---|
| Previous Owner | Bollinger Michael T | $165,000 |
Source: Public Records
Tax History
| Year | Tax Paid | Tax Assessment Tax Assessment Total Assessment is a certain percentage of the fair market value that is determined by local assessors to be the total taxable value of land and additions on the property. | Land | Improvement |
|---|---|---|---|---|
| 2025 | $1,633 | $411,900 | $145,700 | $266,200 |
| 2023 | $1,401 | $255,100 | $79,100 | $176,000 |
| 2022 | $1,413 | $255,100 | $79,100 | $176,000 |
| 2021 | $1,409 | $255,100 | $79,100 | $176,000 |
| 2020 | $1,367 | $216,100 | $52,300 | $163,800 |
| 2019 | $1,367 | $216,100 | $52,300 | $163,800 |
| 2018 | $1,367 | $216,100 | $52,300 | $163,800 |
| 2017 | $1,399 | $216,100 | $52,300 | $163,800 |
| 2016 | $1,270 | $183,200 | $52,300 | $130,900 |
| 2015 | $1,180 | $183,200 | $52,300 | $130,900 |
| 2014 | $1,160 | $183,200 | $52,300 | $130,900 |
Source: Public Records
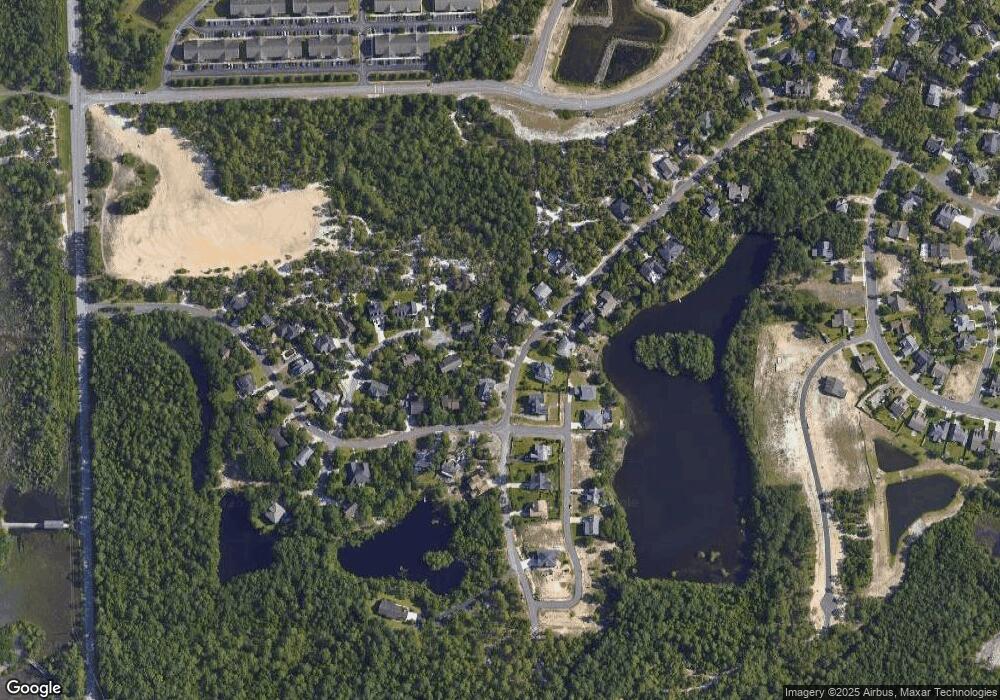
Map
Nearby Homes
- 128 Bella Port Ln
- 123 Bella Port Ln
- 400 Okeechobee Rd
- 109 Island Bridge Way
- 7613 Saint Clair Dr
- 6929 Ontario Rd
- 7830 Champlain Dr
- 6816 Teviot Rd
- 114 Colquitt Dr
- 6604 Stoddard Rd
- 109 Maypop Ct
- 101 Spanish Moss Way
- 409 Passage Gate Way
- 607 Laveen Way
- 205 Royal Fern Rd
- 205 Hepworth Way
- 654 Castine Way
- 8119 Yellow Daisy Dr
- 8120 River Rd
- 330 McQuillan Dr
- 7600 Pontchartrain Rd
- 307 Okeechobee Rd
- 7602 Pontchartrain Rd
- 301 Okeechobee Rd
- 304 Okeechobee Rd
- 7601 Pontchartrain Rd
- 211 Watauga Rd
- 311 Okeechobee Rd
- 300 Okeechobee Rd
- 308 Okeechobee Rd
- 7608 Pontchartrain Rd
- 312 Okeechobee Rd
- 7605 Pontchartrain Rd
- 207 Watauga Rd
- 7601 Waccamaw Ct
- 315 Okeechobee Rd
- 294 Okeechobee Rd Unit 1616
- 212 Watauga Rd
- 164 Rice Marsh Way
- 316 Okeechobee Rd
Your Personal Tour Guide
Ask me questions while you tour the home.