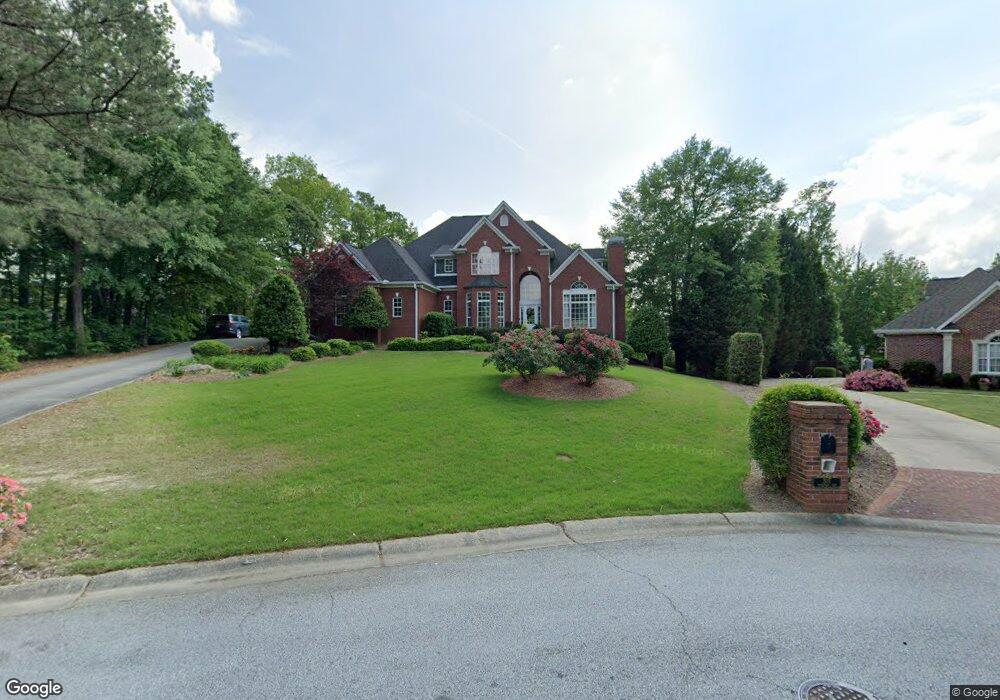
305 Pinehurst Way Carrollton, GA 30116
Estimated Value: $713,893 - $757,000
4
Beds
4
Baths
3,452
Sq Ft
$214/Sq Ft
Est. Value
About This Home
This home is located at 305 Pinehurst Way, Carrollton, GA 30116 and is currently estimated at $738,631, approximately $213 per square foot. 305 Pinehurst Way is a home located in Carroll County with nearby schools including Carrollton Elementary School, Carrollton Upper Elementary School, and Carrollton Middle School.
Ownership History
Date
Name
Owned For
Owner Type
Purchase Details
Closed on
Jan 30, 2017
Sold by
Haney Edith F
Bought by
Haney Richard M and Haney Edith F
Current Estimated Value
Home Financials for this Owner
Home Financials are based on the most recent Mortgage that was taken out on this home.
Original Mortgage
$435,621
Outstanding Balance
$221,075
Interest Rate
4.32%
Mortgage Type
Purchase Money Mortgage
Estimated Equity
$517,556
Purchase Details
Closed on
Jul 6, 2006
Sold by
Haney Development Llc
Bought by
Haney Edith F
Home Financials for this Owner
Home Financials are based on the most recent Mortgage that was taken out on this home.
Original Mortgage
$373,200
Interest Rate
6.54%
Mortgage Type
New Conventional
Purchase Details
Closed on
Feb 7, 2002
Sold by
Oak Mountain Champio
Bought by
Haney Development Llc
Purchase Details
Closed on
Apr 16, 1999
Bought by
Oak Mountain Champio
Create a Home Valuation Report for This Property
The Home Valuation Report is an in-depth analysis detailing your home's value as well as a comparison with similar homes in the area
Home Values in the Area
Average Home Value in this Area
Purchase History
| Date | Buyer | Sale Price | Title Company |
|---|---|---|---|
| Haney Richard M | -- | -- | |
| Haney Edith F | -- | -- | |
| Haney Development Llc | $48,600 | -- | |
| Oak Mountain Champio | -- | -- |
Source: Public Records
Mortgage History
| Date | Status | Borrower | Loan Amount |
|---|---|---|---|
| Open | Haney Richard M | $435,621 | |
| Previous Owner | Haney Edith F | $373,200 |
Source: Public Records
Tax History Compared to Growth
Tax History
| Year | Tax Paid | Tax Assessment Tax Assessment Total Assessment is a certain percentage of the fair market value that is determined by local assessors to be the total taxable value of land and additions on the property. | Land | Improvement |
|---|---|---|---|---|
| 2024 | $7,836 | $323,994 | $26,000 | $297,994 |
| 2023 | $7,836 | $297,789 | $26,000 | $271,789 |
| 2022 | $6,462 | $244,309 | $26,000 | $218,309 |
| 2021 | $6,202 | $232,991 | $26,000 | $206,991 |
| 2020 | $5,791 | $214,942 | $28,000 | $186,942 |
| 2019 | $5,503 | $200,394 | $28,000 | $172,394 |
| 2018 | $5,107 | $180,466 | $28,000 | $152,466 |
| 2017 | $5,132 | $180,466 | $28,000 | $152,466 |
| 2016 | $5,161 | $180,466 | $28,000 | $152,466 |
| 2015 | $4,668 | $155,147 | $20,000 | $135,148 |
| 2014 | $4,689 | $155,148 | $20,000 | $135,148 |
Source: Public Records
Map
Nearby Homes
- 307 Pinehurst Way
- 806 Birkdale Blvd
- 129 Pinehurst Way
- 808 Birkdale Blvd
- 808 Birkdale Blvd
- 808 Birkdale Blvd
- 808 Birkdale Blvd
- 808 Birkdale Blvd
- 808 Birkdale Blvd
- 802 Birkdale Blvd
- 306 Pinehurst Way
- 103 Medinah Dr
- 304 Pinehurst Way
- 810 Birkdale Blvd
- 101 Medinah Dr
- 300 Pinehurst Way
- 300 Pinehurst Way
- 300 Pinehurst Way
- 0 Medinah Dr
- 812 Birkdale Blvd