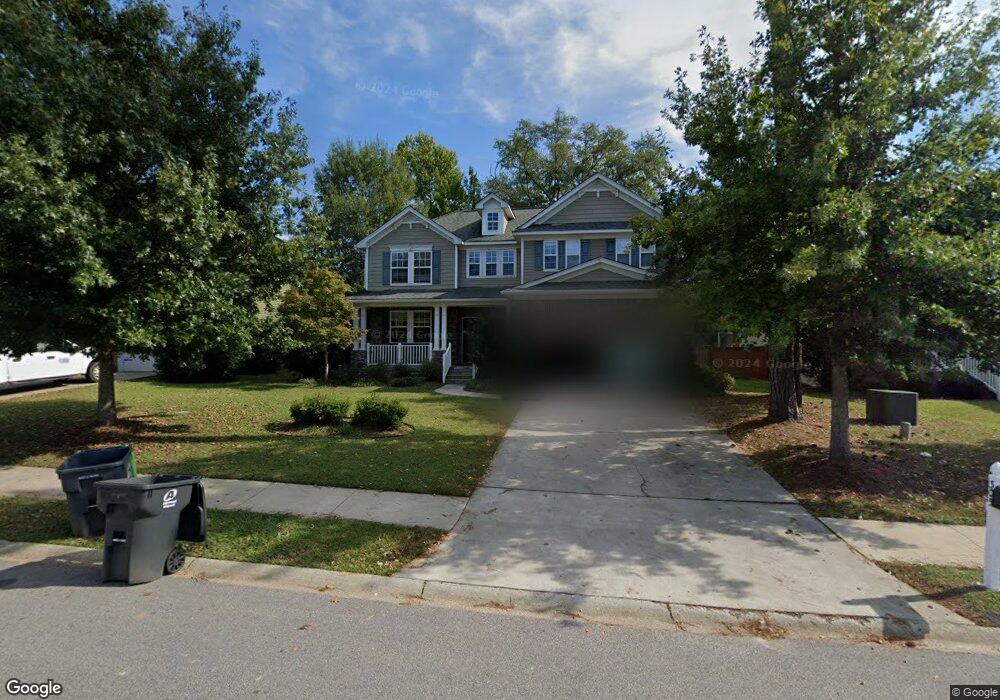
305 Plymouth Pass Dr Lexington, SC 29072
Estimated Value: $346,000 - $391,000
3
Beds
3
Baths
2,465
Sq Ft
$146/Sq Ft
Est. Value
About This Home
This home is located at 305 Plymouth Pass Dr, Lexington, SC 29072 and is currently estimated at $360,334, approximately $146 per square foot. 305 Plymouth Pass Dr is a home located in Lexington County with nearby schools including New Providence Elementary School, River Bluff High School, and American Leadership Academy South Carolina-Lexington Campus.
Ownership History
Date
Name
Owned For
Owner Type
Purchase Details
Closed on
Jun 4, 2024
Sold by
Patel Kinjal V and Patel Viren R
Bought by
Farrington Morris Bryan
Current Estimated Value
Purchase Details
Closed on
Nov 5, 2009
Sold by
Doa Properties Iiib Kb Models Llc
Bought by
Amin Kinjal B and Patel Virendra R
Home Financials for this Owner
Home Financials are based on the most recent Mortgage that was taken out on this home.
Original Mortgage
$220,924
Interest Rate
4.93%
Mortgage Type
FHA
Purchase Details
Closed on
Jun 23, 2008
Sold by
Kbone Llc
Bought by
Doa Properties Iiib Kb Models Llc
Purchase Details
Closed on
Sep 20, 2006
Sold by
Kb Home South Carolina Inc
Bought by
Kbone Llc
Purchase Details
Closed on
Sep 19, 2006
Sold by
Kb Home South Carolina Llc
Bought by
Kbone Llc
Create a Home Valuation Report for This Property
The Home Valuation Report is an in-depth analysis detailing your home's value as well as a comparison with similar homes in the area
Home Values in the Area
Average Home Value in this Area
Purchase History
| Date | Buyer | Sale Price | Title Company |
|---|---|---|---|
| Farrington Morris Bryan | $350,000 | None Listed On Document | |
| Amin Kinjal B | $225,000 | -- | |
| Doa Properties Iiib Kb Models Llc | -- | -- | |
| Kbone Llc | $285,000 | -- | |
| Kbone Llc | $285,000 | None Available |
Source: Public Records
Mortgage History
| Date | Status | Borrower | Loan Amount |
|---|---|---|---|
| Previous Owner | Amin Kinjal B | $220,924 |
Source: Public Records
Tax History Compared to Growth
Tax History
| Year | Tax Paid | Tax Assessment Tax Assessment Total Assessment is a certain percentage of the fair market value that is determined by local assessors to be the total taxable value of land and additions on the property. | Land | Improvement |
|---|---|---|---|---|
| 2024 | $942 | $8,083 | $1,800 | $6,283 |
| 2023 | $942 | $8,083 | $1,800 | $6,283 |
| 2022 | $1,413 | $8,083 | $1,800 | $6,283 |
| 2020 | $1,444 | $8,083 | $1,800 | $6,283 |
| 2019 | $1,364 | $7,190 | $1,200 | $5,990 |
| 2018 | $1,344 | $7,190 | $1,200 | $5,990 |
| 2017 | $1,311 | $7,190 | $1,200 | $5,990 |
| 2016 | $1,301 | $7,190 | $1,200 | $5,990 |
| 2014 | $1,408 | $8,031 | $1,600 | $6,431 |
| 2013 | -- | $8,030 | $1,600 | $6,430 |
Source: Public Records
Map
Nearby Homes
- 420 Plymouth Pass Dr
- 408 Settlers Trail
- 112 Plymouth Pass Dr
- 561 Plymouth Pass Dr
- 154 Pilgrim Church Rd
- 113 Cherokee Pond Ct
- 145 Cherokee Pond Ct
- 712 Bentley Dr
- 109 Armanda Rd
- 2247 Old Cherokee Rd Unit LOT 6
- 2235 Old Cherokee Rd Unit LOT 5
- 2229 Old Cherokee Rd Unit LOT 4
- 2225 Old Cherokee Rd Unit LOT 3
- 2221 Old Cherokee Rd Unit LOT 2
- 130 Power Point Ln
- 108 Hunters Ridge Dr
- 156 Hunters Trail
- 113 Silverstone Rd
- 707 Blue Pixie Ct
- 43 Boardwalk Ln
- 309 Plymouth Pass Dr
- 301 Plymouth Pass Dr
- 104 Settlers Ct
- 313 Plymouth Pass Dr
- 108 Settlers Ct
- 100 Settlers Ct
- 304 Plymouth Pass Dr
- 112 Settlers Ct
- 308 Plymouth Pass Dr
- 300 Plymouth Pass Dr
- 317 Plymouth Pass Dr
- 312 Plymouth Pass Dr
- 116 Settlers Ct
- 201 Settlers Trail
- 205 Settlers Trail
- 316 Plymouth Pass Dr
- 209 Settlers Trail
- 321 Plymouth Pass Dr
- 212 Plymouth Pass Dr
- 300 Settlers Trail