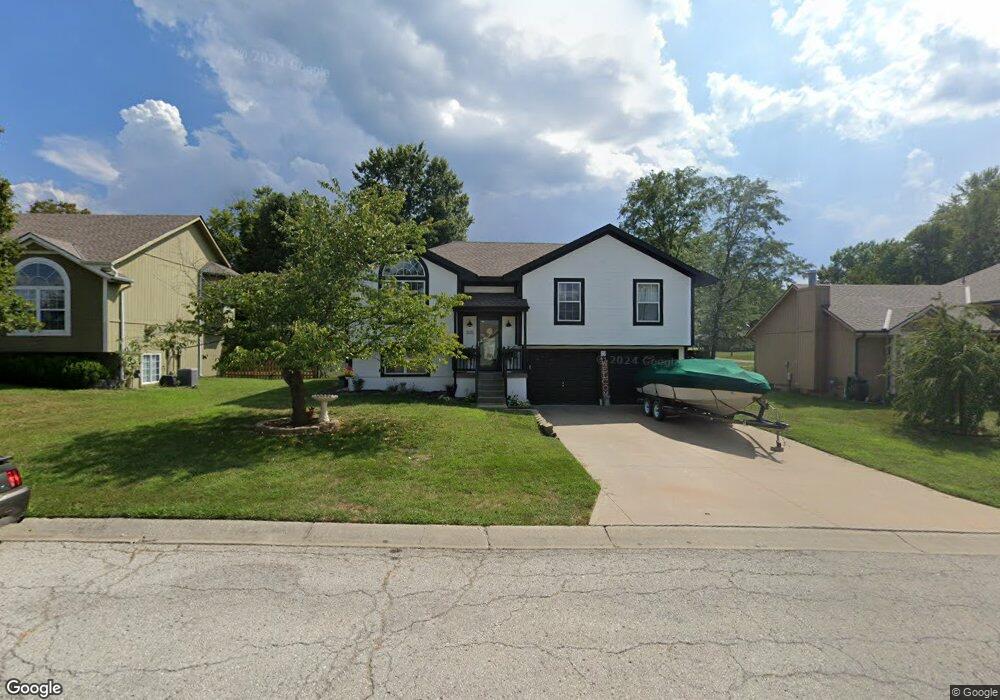
305 Poplar St Peculiar, MO 64078
Estimated Value: $266,000 - $327,000
3
Beds
2
Baths
1,272
Sq Ft
$230/Sq Ft
Est. Value
About This Home
This home is located at 305 Poplar St, Peculiar, MO 64078 and is currently estimated at $292,539, approximately $229 per square foot. 305 Poplar St is a home located in Cass County with nearby schools including Peculiar Elementary School, Raymore-Peculiar South Middle School, and Raymore-Peculiar Senior High School.
Ownership History
Date
Name
Owned For
Owner Type
Purchase Details
Closed on
Nov 14, 2017
Sold by
Emry James W and Emry Gretchen L
Bought by
Cron Kristen A and Cron Robert M
Current Estimated Value
Home Financials for this Owner
Home Financials are based on the most recent Mortgage that was taken out on this home.
Original Mortgage
$160,550
Outstanding Balance
$134,746
Interest Rate
3.91%
Mortgage Type
New Conventional
Estimated Equity
$157,793
Purchase Details
Closed on
Mar 5, 2015
Sold by
Bronson Laura M
Bought by
Emry James W and Emry Gretchen L
Home Financials for this Owner
Home Financials are based on the most recent Mortgage that was taken out on this home.
Original Mortgage
$135,000
Interest Rate
3.6%
Mortgage Type
New Conventional
Purchase Details
Closed on
Jan 23, 2012
Sold by
Kozeny & Mccubbin Lc
Bought by
Federal Home Loan Mortgage Corporation
Purchase Details
Closed on
Jan 1, 2012
Sold by
Bronson Brent Alan
Bought by
Bronson Laura Michelle
Create a Home Valuation Report for This Property
The Home Valuation Report is an in-depth analysis detailing your home's value as well as a comparison with similar homes in the area
Home Values in the Area
Average Home Value in this Area
Purchase History
| Date | Buyer | Sale Price | Title Company |
|---|---|---|---|
| Cron Kristen A | -- | Kansas City Title Inc | |
| Emry James W | -- | None Available | |
| Federal Home Loan Mortgage Corporation | $111,684 | None Available | |
| Bronson Laura Michelle | -- | None Available |
Source: Public Records
Mortgage History
| Date | Status | Borrower | Loan Amount |
|---|---|---|---|
| Open | Cron Kristen A | $160,550 | |
| Previous Owner | Emry James W | $135,000 |
Source: Public Records
Tax History Compared to Growth
Tax History
| Year | Tax Paid | Tax Assessment Tax Assessment Total Assessment is a certain percentage of the fair market value that is determined by local assessors to be the total taxable value of land and additions on the property. | Land | Improvement |
|---|---|---|---|---|
| 2024 | $2,279 | $28,860 | $2,750 | $26,110 |
| 2023 | $2,264 | $28,860 | $2,750 | $26,110 |
| 2022 | $2,077 | $25,620 | $2,750 | $22,870 |
| 2021 | $2,148 | $25,620 | $2,750 | $22,870 |
| 2020 | $2,071 | $24,690 | $2,750 | $21,940 |
| 2019 | $2,068 | $24,690 | $2,750 | $21,940 |
| 2018 | $1,964 | $22,120 | $2,330 | $19,790 |
| 2017 | $1,865 | $22,120 | $2,330 | $19,790 |
| 2016 | $1,865 | $20,940 | $2,330 | $18,610 |
| 2015 | $1,813 | $20,940 | $2,330 | $18,610 |
| 2014 | $1,602 | $20,370 | $2,330 | $18,040 |
| 2013 | -- | $20,370 | $2,330 | $18,040 |
Source: Public Records
Map
Nearby Homes
- 404 W 3rd St
- 132 E North St
- 11408 Summerskill Rd
- Lot 1 Main St
- 316 N Main St
- 0 N Main St
- 600 Schug Ave
- 231 E 1st St
- 504 W 5th Ct
- 20100 S St Rt J Hwy
- 729 Hurley St
- 10909 Highview Rd
- 21810 Southcreek Rd
- Aldridge Plan at Bradley's Crossing
- Newcastle Plan at Bradley's Crossing
- Bellamy Plan at Bradley's Crossing
- Harmony Plan at Bradley's Crossing
- Holcombe Plan at Bradley's Crossing
- 11014 E Ridge Ct
- 11016 E Ridge Ct