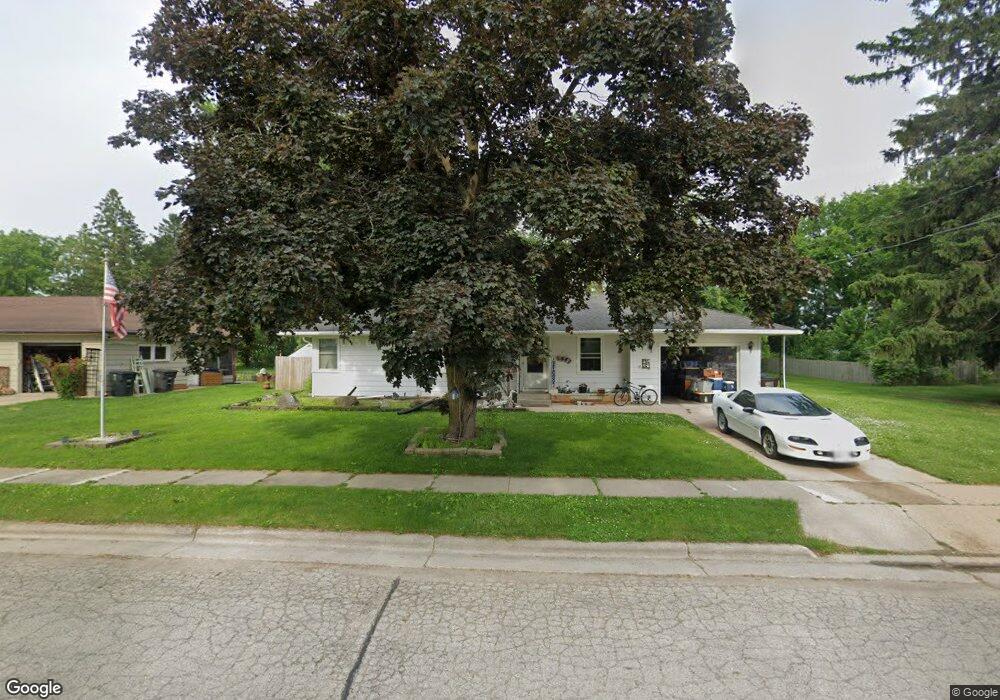
305 S 3rd St Waterford, WI 53185
Estimated Value: $312,000 - $365,000
--
Bed
--
Bath
--
Sq Ft
6,490
Sq Ft Lot
About This Home
This home is located at 305 S 3rd St, Waterford, WI 53185 and is currently estimated at $337,093. 305 S 3rd St is a home located in Racine County with nearby schools including Trailside Elementary School, Fox River Middle School, and Waterford High School.
Ownership History
Date
Name
Owned For
Owner Type
Purchase Details
Closed on
Jul 22, 2016
Sold by
Halbach Lindsay A
Bought by
Kerznar Mark
Current Estimated Value
Home Financials for this Owner
Home Financials are based on the most recent Mortgage that was taken out on this home.
Original Mortgage
$168,547
Outstanding Balance
$134,378
Interest Rate
3.54%
Mortgage Type
VA
Estimated Equity
$202,715
Purchase Details
Closed on
Jul 21, 2016
Sold by
Halbach Harold and Violet Halbach Living Trust
Bought by
Halbah Lindsay A
Home Financials for this Owner
Home Financials are based on the most recent Mortgage that was taken out on this home.
Original Mortgage
$168,547
Outstanding Balance
$134,378
Interest Rate
3.54%
Mortgage Type
VA
Estimated Equity
$202,715
Purchase Details
Closed on
Aug 1, 2013
Sold by
Halbach Harold and Halbach Harold
Bought by
Halbach Lindsay A
Purchase Details
Closed on
Mar 16, 2011
Sold by
Halbach Harold F
Bought by
Harold And Violet Halbach Living Trust
Create a Home Valuation Report for This Property
The Home Valuation Report is an in-depth analysis detailing your home's value as well as a comparison with similar homes in the area
Home Values in the Area
Average Home Value in this Area
Purchase History
| Date | Buyer | Sale Price | Title Company |
|---|---|---|---|
| Kerznar Mark | $165,000 | Us Title And Closing Service | |
| Halbah Lindsay A | -- | Us Title And Closing Service | |
| Halbach Lindsay A | $20,000 | None Available | |
| Harold And Violet Halbach Living Trust | -- | None Available |
Source: Public Records
Mortgage History
| Date | Status | Borrower | Loan Amount |
|---|---|---|---|
| Open | Kerznar Mark | $168,547 | |
| Closed | Halbach Lindsay A | $0 |
Source: Public Records
Tax History Compared to Growth
Tax History
| Year | Tax Paid | Tax Assessment Tax Assessment Total Assessment is a certain percentage of the fair market value that is determined by local assessors to be the total taxable value of land and additions on the property. | Land | Improvement |
|---|---|---|---|---|
| 2024 | $3,702 | $240,600 | $42,000 | $198,600 |
| 2023 | $3,594 | $223,500 | $42,000 | $181,500 |
| 2022 | $3,245 | $176,600 | $42,000 | $134,600 |
| 2021 | $3,034 | $170,300 | $42,000 | $128,300 |
| 2020 | $3,053 | $130,400 | $22,500 | $107,900 |
| 2019 | $3,002 | $130,400 | $22,500 | $107,900 |
| 2018 | $2,912 | $130,400 | $22,500 | $107,900 |
| 2017 | $2,816 | $130,400 | $22,500 | $107,900 |
| 2016 | $2,848 | $129,400 | $22,500 | $106,900 |
| 2015 | $2,764 | $129,400 | $22,500 | $106,900 |
| 2014 | $2,448 | $125,500 | $23,100 | $102,400 |
| 2013 | $2,531 | $125,500 | $23,100 | $102,400 |
Source: Public Records
Map
Nearby Homes
- 317 Trailview Crossing Unit 15
- 310 N Trailview Cir
- 311 N Trailview Cir
- 319 N Trailview Cir Unit 35
- 313 N Trailview Cir Unit 34
- 318 E Main St
- 500 E Main St Unit 306
- 500 E Main St Unit 303
- 500 E Main St Unit 301
- 500 E Main St Unit 304
- 500 E Main St Unit 205
- 500 E Main St Unit 203
- 500 E Main St Unit 202
- 522 E Main St
- Lt1 6th St
- 601 Amber Dr
- 602 Amber Dr
- 29134 Evergreen Dr
- 312 N Trailview Cir Unit 25
- 635 Aber Dr
- 303 S 3rd St
- 401 S 3rd St
- 304 S 3rd St
- 400 S 3rd St
- 301 S 3rd St
- 300 S 3rd St
- 304 Superior St
- 309 E Saint Thomas St
- 305 Superior St
- 309 S 2nd St
- 310 E Saint Thomas St
- 306 Trailview Crossing
- 307 Trailview Crossing
- 308 Trailview Crossing Unit 27
- 308 Trailview Crossing
- 310 Trailview Crossing
- 311 Trailview Crossing
- 312 Trailview Crossing Unit 25
- 301 S 2nd St
- 205 S 3rd St