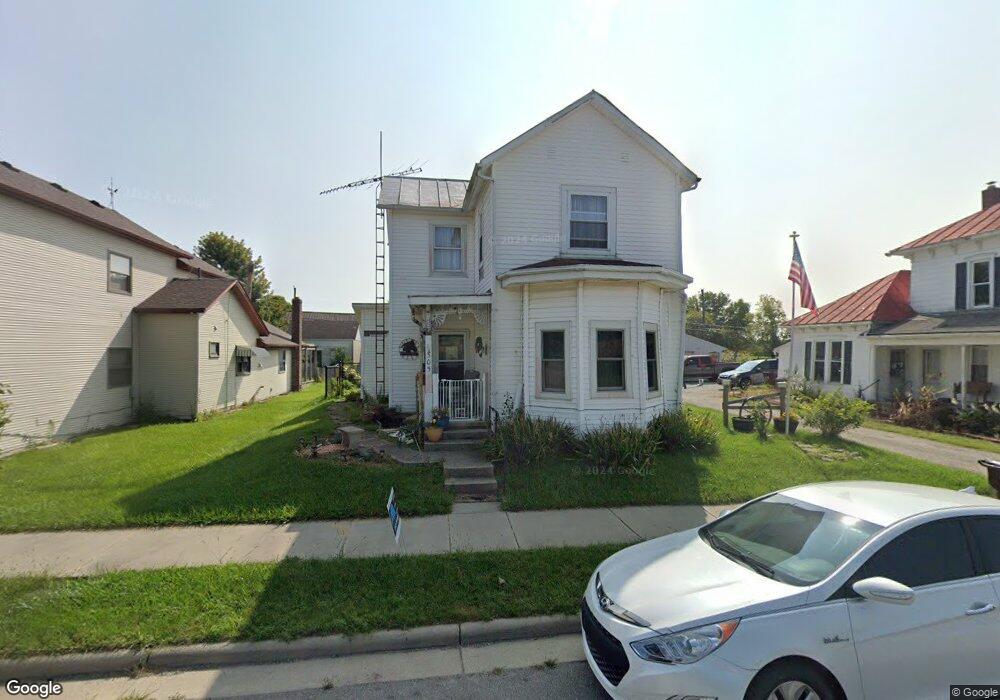
305 S Main St West Manchester, OH 45382
Estimated Value: $134,000 - $180,000
3
Beds
2
Baths
1,483
Sq Ft
$104/Sq Ft
Est. Value
About This Home
This home is located at 305 S Main St, West Manchester, OH 45382 and is currently estimated at $154,271, approximately $104 per square foot. 305 S Main St is a home located in Preble County with nearby schools including National Trail Elementary School, National Trail Middle School, and National Trail High School.
Ownership History
Date
Name
Owned For
Owner Type
Purchase Details
Closed on
Oct 16, 2019
Sold by
Wells Cynthia A
Bought by
Padgett Tiffany N and Cynthia A Wells Family Preserv
Current Estimated Value
Purchase Details
Closed on
Oct 16, 2015
Sold by
Greenville National Bank
Bought by
Wells Cynthia A
Purchase Details
Closed on
Dec 4, 2014
Sold by
Posadny Roy S
Bought by
Greenville National Bank
Purchase Details
Closed on
May 22, 2003
Sold by
Lawson Tommy E and Lawson Brenda K
Bought by
Bowman Tonya and Bowman Tonya G
Home Financials for this Owner
Home Financials are based on the most recent Mortgage that was taken out on this home.
Original Mortgage
$68,000
Interest Rate
5.9%
Mortgage Type
Purchase Money Mortgage
Purchase Details
Closed on
Oct 22, 1999
Sold by
Mcgriff Marvin
Bought by
Lawson Tommy F and Lawson Brenda
Create a Home Valuation Report for This Property
The Home Valuation Report is an in-depth analysis detailing your home's value as well as a comparison with similar homes in the area
Home Values in the Area
Average Home Value in this Area
Purchase History
| Date | Buyer | Sale Price | Title Company |
|---|---|---|---|
| Padgett Tiffany N | -- | None Available | |
| Wells Cynthia A | $35,000 | Performance Title | |
| Greenville National Bank | $43,400 | None Available | |
| Bowman Tonya | -- | None Available | |
| Lawson Tommy F | $47,500 | -- |
Source: Public Records
Mortgage History
| Date | Status | Borrower | Loan Amount |
|---|---|---|---|
| Previous Owner | Bowman Tonya | $68,000 |
Source: Public Records
Tax History Compared to Growth
Tax History
| Year | Tax Paid | Tax Assessment Tax Assessment Total Assessment is a certain percentage of the fair market value that is determined by local assessors to be the total taxable value of land and additions on the property. | Land | Improvement |
|---|---|---|---|---|
| 2024 | $1,425 | $35,530 | $3,780 | $31,750 |
| 2023 | $1,425 | $35,530 | $3,780 | $31,750 |
| 2022 | $1,198 | $25,450 | $2,800 | $22,650 |
| 2021 | $1,253 | $25,450 | $2,800 | $22,650 |
| 2020 | $1,123 | $25,450 | $2,800 | $22,650 |
| 2019 | $898 | $20,160 | $2,520 | $17,640 |
| 2018 | $883 | $20,160 | $2,520 | $17,640 |
| 2017 | $915 | $20,160 | $2,520 | $17,640 |
| 2016 | $776 | $19,010 | $2,520 | $16,490 |
| 2014 | $2,904 | $19,010 | $2,520 | $16,490 |
| 2013 | $807 | $19,005 | $2,520 | $16,485 |
Source: Public Records
Map
Nearby Homes
- 383 Georgetown Verona Rd
- 0 E Scott Unit 942470
- 792 W Holtzmuller Rd
- 230 Stephens Rd
- 246 N Main St
- 8486 Us Route 127
- 210 N Main St
- 501 N Maple St
- 0 W US 40
- 9923 Euphemia Castine Rd
- 10995 Rockridge Rd
- 2892 Swishers Mill Rd
- 0 Friday Rd
- 2294 U S 40
- 6254 State Route 722
- 7337 E Lock Rd
- 6806 Darke-Preble County Line Rd
- 693 Friday Rd
- 140 State Route 503
- 0 Ohio 722 Unit 10051560
- 301 S Main St
- 309 S Main St
- 300 S Main St
- 220 S High St
- 220 S Main St
- 306 S High St
- 214 S High St
- 110 Jefferson St
- 110 Jefferson St
- 211 S Main St
- 201 S Main St
- 120 Jefferson St
- 112 E Jefferson St
- 215 S High St
- 210 S Main St
- 200 E Jefferson St
- 211 Maple St
- 211 Maple St
- 238 Jefferson St
- 226 Jefferson St