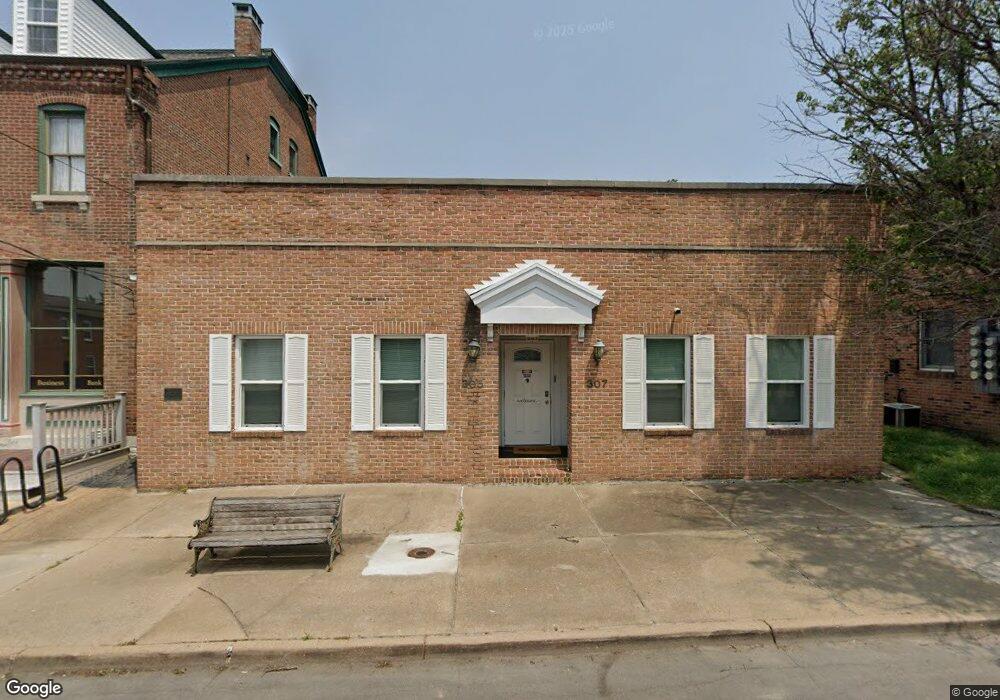
305 Saint Francois St Florissant, MO 63031
Estimated Value: $247,000
--
Bed
7
Baths
3,090
Sq Ft
$80/Sq Ft
Est. Value
About This Home
This home is located at 305 Saint Francois St, Florissant, MO 63031 and is currently estimated at $247,000, approximately $79 per square foot. 305 Saint Francois St is a home located in St. Louis County with nearby schools including Combs Elementary School, Cross Keys Middle School, and McCluer North High School.
Ownership History
Date
Name
Owned For
Owner Type
Purchase Details
Closed on
May 26, 2020
Sold by
Wmac 2013 Llc
Bought by
Sheld Llc
Current Estimated Value
Home Financials for this Owner
Home Financials are based on the most recent Mortgage that was taken out on this home.
Original Mortgage
$123,750
Outstanding Balance
$109,452
Interest Rate
3.2%
Mortgage Type
Future Advance Clause Open End Mortgage
Estimated Equity
$137,548
Purchase Details
Closed on
Mar 18, 2015
Sold by
Citizens National Bank Of Greater St Lou
Bought by
Wmc2013 Llc
Purchase Details
Closed on
Sep 2, 2014
Sold by
Miller Kent B and Miller Vicki L
Bought by
Wmac 2013 Llc
Purchase Details
Closed on
Apr 30, 1998
Sold by
Schulte G Joseph and Schulte Dolores M
Bought by
Miller Kent B and Miller Vicki L
Home Financials for this Owner
Home Financials are based on the most recent Mortgage that was taken out on this home.
Original Mortgage
$120,000
Interest Rate
8%
Mortgage Type
Seller Take Back
Create a Home Valuation Report for This Property
The Home Valuation Report is an in-depth analysis detailing your home's value as well as a comparison with similar homes in the area
Home Values in the Area
Average Home Value in this Area
Purchase History
| Date | Buyer | Sale Price | Title Company |
|---|---|---|---|
| Sheld Llc | $107,500 | Investors Title Co Clayton | |
| Wmc2013 Llc | -- | None Available | |
| Wmac 2013 Llc | $16,146 | None Available | |
| Miller Kent B | -- | -- |
Source: Public Records
Mortgage History
| Date | Status | Borrower | Loan Amount |
|---|---|---|---|
| Open | Sheld Llc | $123,750 | |
| Previous Owner | Miller Kent B | $120,000 |
Source: Public Records
Tax History Compared to Growth
Tax History
| Year | Tax Paid | Tax Assessment Tax Assessment Total Assessment is a certain percentage of the fair market value that is determined by local assessors to be the total taxable value of land and additions on the property. | Land | Improvement |
|---|---|---|---|---|
| 2025 | $4,900 | $57,980 | $9,500 | $48,480 |
| 2024 | $4,900 | $43,710 | $9,500 | $34,210 |
| 2023 | $4,900 | $43,710 | $9,500 | $34,210 |
| 2022 | $4,477 | $38,460 | $9,500 | $28,960 |
| 2021 | $4,381 | $38,460 | $9,500 | $28,960 |
| 2020 | $3,852 | $33,850 | $12,670 | $21,180 |
| 2019 | $3,735 | $33,850 | $12,670 | $21,180 |
| 2018 | $3,896 | $33,410 | $12,670 | $20,740 |
Source: Public Records
Map
Nearby Homes
- 410 N Jefferson St
- 260 N Jefferson St
- 580 Saint Marie St
- 790 Harrison St
- 1105 Patterson Rd
- 175 Clark St
- 216 Graham Rd
- 305 S Lafayette St
- 1365 Saint Jean St
- 940 Harrison St
- 1023 Saint Denis St
- 1148 Boone St
- 130 Ruth Dr
- 201 Brower Ln
- 1090 Saint Joseph St
- 1540 Angelus Dr
- 1480 Vesper Dr
- 37 Marquette Dr
- 710 Thompson Dr
- 540 S Jefferson St
- 302 Rue Saint Francois St
- 659 Saint Pierre St
- 298 Rue Saint Francois St Unit ANCOIS
- 309 Saint Francois St
- 309 Rue St Francois
- 663 St Pierre 667 St
- 663 Rue Saint Pierre 667 St
- 225 Saint Francois St
- 298 Saint Francois St
- 225 Rue Saint Francois St Unit ANCOIS
- 225 Rue Saint Francois St Unit FRANCO
- 225 Rue Saint Francois St
- 306 Saint Francois St
- 663 Saint Pierre St
- 310 Saint Francois St
- 300 Saint Louis St
- 315 Rue Saint Francois St
- 663667 St Pierre St
- 663667 Saint Pierre St
- 306 Saint Louis St