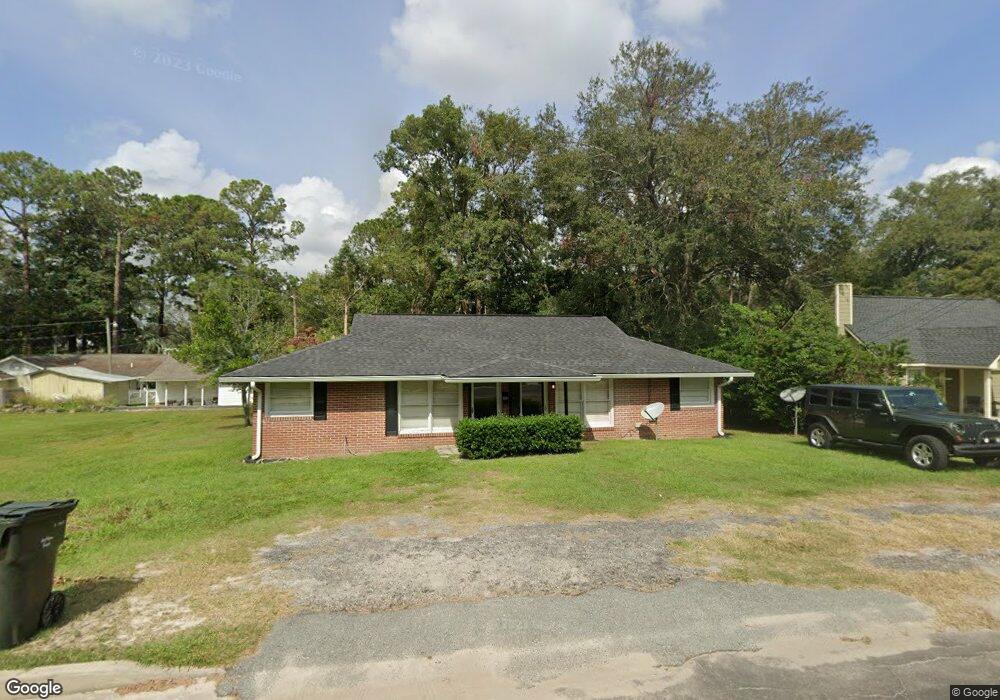
305 Scruggs St Waycross, GA 31501
Estimated Value: $124,000 - $185,000
4
Beds
2
Baths
1,500
Sq Ft
$104/Sq Ft
Est. Value
About This Home
This home is located at 305 Scruggs St, Waycross, GA 31501 and is currently estimated at $155,284, approximately $103 per square foot. 305 Scruggs St is a home located in Ware County with nearby schools including Williams Heights Elementary School, Waycross Middle School, and Ware County High School.
Ownership History
Date
Name
Owned For
Owner Type
Purchase Details
Closed on
Oct 18, 2019
Sold by
Allen Jennifer D
Bought by
Harvest Properties And Investments Llc
Current Estimated Value
Home Financials for this Owner
Home Financials are based on the most recent Mortgage that was taken out on this home.
Original Mortgage
$75,194
Outstanding Balance
$58,395
Interest Rate
3.7%
Mortgage Type
Commercial
Estimated Equity
$96,889
Purchase Details
Closed on
Jul 7, 2004
Sold by
Allen Jennifer D
Bought by
Allen Jennifer D
Purchase Details
Closed on
Sep 5, 2002
Sold by
Allen Hugh T
Bought by
Allen Jennifer D
Purchase Details
Closed on
Jan 23, 2002
Sold by
Joyce Alonzo and Joyce Janet
Bought by
Allen Hugh T
Purchase Details
Closed on
Jan 23, 2001
Sold by
Allen Delene T
Bought by
Joyce Alonzo and Joyce Janet
Purchase Details
Closed on
Jun 13, 1991
Bought by
Allen Delene T
Create a Home Valuation Report for This Property
The Home Valuation Report is an in-depth analysis detailing your home's value as well as a comparison with similar homes in the area
Home Values in the Area
Average Home Value in this Area
Purchase History
| Date | Buyer | Sale Price | Title Company |
|---|---|---|---|
| Harvest Properties And Investments Llc | $75,000 | -- | |
| Allen Jennifer D | -- | -- | |
| Allen Jennifer D | $10,000 | -- | |
| Allen Hugh T | -- | -- | |
| Joyce Alonzo | -- | -- | |
| Allen Delene T | $32,500 | -- |
Source: Public Records
Mortgage History
| Date | Status | Borrower | Loan Amount |
|---|---|---|---|
| Open | Harvest Properties And Investments Llc | $75,194 |
Source: Public Records
Tax History Compared to Growth
Tax History
| Year | Tax Paid | Tax Assessment Tax Assessment Total Assessment is a certain percentage of the fair market value that is determined by local assessors to be the total taxable value of land and additions on the property. | Land | Improvement |
|---|---|---|---|---|
| 2024 | $2,356 | $58,880 | $2,560 | $56,320 |
| 2023 | $2,030 | $39,031 | $2,105 | $36,926 |
| 2022 | $1,562 | $39,199 | $2,105 | $37,094 |
| 2021 | $1,391 | $32,165 | $2,105 | $30,060 |
| 2020 | $1,212 | $27,817 | $2,105 | $25,712 |
| 2019 | $1,190 | $26,911 | $2,105 | $24,806 |
| 2018 | $1,161 | $26,005 | $2,105 | $23,900 |
| 2017 | $1,134 | $26,005 | $2,105 | $23,900 |
| 2016 | $1,134 | $26,005 | $2,105 | $23,900 |
| 2015 | $1,142 | $26,005 | $2,105 | $23,900 |
| 2014 | $1,141 | $26,005 | $2,105 | $23,900 |
| 2013 | -- | $21,530 | $2,105 | $19,424 |
Source: Public Records
Map
Nearby Homes
- 415 Dewey St
- 502 Dewey St
- 807 College St
- 506 Magnolia Dr
- 310 Butler St
- 924 Highsmith St
- 1405 Grove Ave
- 301 Riverside Dr
- 511 Richmond Ave
- 418 Reed St
- 808 Satilla Blvd
- 1101 Cherokee Dr
- 306 Lee Ave
- 0 Goodwin St
- 511 Riverside Dr
- 1504 Habersham Dr
- 713 Magnolia Dr
- .22 Alice St
- 707 Euclid Ave
- 705 Gilmore St
- 309 Scruggs St
- 307 Dewey St
- 314 College St
- 306 College St
- 308 Scruggs St
- 300 Scruggs St
- 0 Dewey St Unit 1651884
- 0 Dewey St Unit 10251851
- 0 Dewey St Unit 1644736
- 0 Dewey St Unit 34524
- 0 Dewey St Unit 3070159
- 0 Dewey St
- 401 Scruggs St
- 400 College St
- 315 Hill St
- 223 Scruggs St
- 307 College St
- 301 College St
- 401 College St
- 309 College St