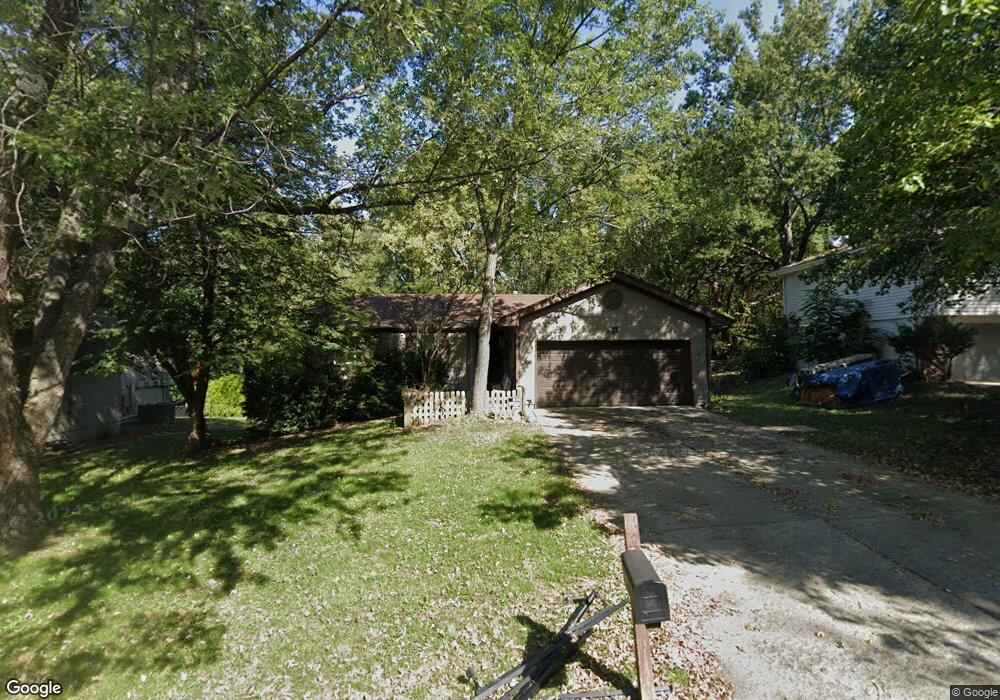
305 SE Shamrock Ln Blue Springs, MO 64014
Estimated Value: $266,000 - $271,000
3
Beds
3
Baths
1,052
Sq Ft
$255/Sq Ft
Est. Value
About This Home
This home is located at 305 SE Shamrock Ln, Blue Springs, MO 64014 and is currently estimated at $268,370, approximately $255 per square foot. 305 SE Shamrock Ln is a home located in Jackson County with nearby schools including Daniel Young Elementary School, Moreland Ridge Middle School, and Blue Springs South High School.
Ownership History
Date
Name
Owned For
Owner Type
Purchase Details
Closed on
Jul 16, 2021
Sold by
Toles Janet and Moritz Annette J
Bought by
Brummet Lisa and Toles Janet
Current Estimated Value
Home Financials for this Owner
Home Financials are based on the most recent Mortgage that was taken out on this home.
Original Mortgage
$125,000
Outstanding Balance
$113,244
Interest Rate
2.8%
Mortgage Type
New Conventional
Estimated Equity
$155,126
Purchase Details
Closed on
Apr 9, 2018
Sold by
Brummett Lisa
Bought by
Brummett Lisa and Toles Janet
Purchase Details
Closed on
Jan 15, 2015
Sold by
Moneymaker Nancy Joan
Bought by
Nancy Joan Moneymaker Trust
Purchase Details
Closed on
Jul 15, 1996
Sold by
Billings Scott A and Billings Mary A
Bought by
Moneymaker Lyle B and Moneymaker Nancy Joan
Home Financials for this Owner
Home Financials are based on the most recent Mortgage that was taken out on this home.
Original Mortgage
$64,000
Interest Rate
8.33%
Mortgage Type
Purchase Money Mortgage
Create a Home Valuation Report for This Property
The Home Valuation Report is an in-depth analysis detailing your home's value as well as a comparison with similar homes in the area
Home Values in the Area
Average Home Value in this Area
Purchase History
| Date | Buyer | Sale Price | Title Company |
|---|---|---|---|
| Brummet Lisa | -- | None Available | |
| Brummett Lisa | -- | None Available | |
| Nancy Joan Moneymaker Trust | -- | None Available | |
| Moneymaker Lyle B | -- | -- |
Source: Public Records
Mortgage History
| Date | Status | Borrower | Loan Amount |
|---|---|---|---|
| Open | Brummet Lisa | $125,000 | |
| Closed | Moneymaker Lyle B | $64,000 |
Source: Public Records
Tax History Compared to Growth
Tax History
| Year | Tax Paid | Tax Assessment Tax Assessment Total Assessment is a certain percentage of the fair market value that is determined by local assessors to be the total taxable value of land and additions on the property. | Land | Improvement |
|---|---|---|---|---|
| 2025 | $3,455 | $40,455 | $6,253 | $34,202 |
| 2024 | $3,389 | $42,355 | $4,879 | $37,476 |
| 2023 | $3,389 | $42,355 | $4,640 | $37,715 |
| 2022 | $2,770 | $30,590 | $4,484 | $26,106 |
| 2021 | $2,767 | $30,590 | $4,484 | $26,106 |
| 2020 | $2,596 | $29,190 | $4,484 | $24,706 |
| 2019 | $2,510 | $29,190 | $4,484 | $24,706 |
| 2018 | $2,242 | $25,105 | $3,674 | $21,431 |
| 2017 | $2,046 | $25,105 | $3,674 | $21,431 |
| 2016 | $2,046 | $22,965 | $3,327 | $19,638 |
| 2014 | $2,012 | $22,515 | $3,262 | $19,253 |
Source: Public Records
Map
Nearby Homes
- 309 SE Shawn Ct
- 2601 SE 5th Street Ct
- 404 SW Shamrock Place
- 408 SW Shamrock Place
- 104 SE Sherri Ln
- 3101 S 1 St
- 1917 SE Abbey St
- 309 SW Moreland School Rd
- 208 SE Mount Vernon Dr
- 1820 SW Keystone Dr
- 815 SE Shamrock Ln
- 1901 SW Gladstone Dr
- 1628 SE 1st Street Terrace
- 407 SE Hamilton Ct
- 2115 S 7 Hwy
- 8004 SE 6th St
- 1616 SE 1st Street Terrace
- 820 SE Partridge Ln
- 4805 SW 6th St
- 4809 SW 6th St
- 309 SE Shamrock Ln
- 301 SE Shamrock Ln
- 313 SE Shamrock Ln
- 304 SE Shamrock Ln
- 211 SE Shamrock Ln
- 208 SE Shamrock Ln
- 310 SE Shamrock Ln
- 205 SE Shamrock Ln
- 317 SE Shamrock Ln
- 2604 SE 3rd St
- 316 SE Shamrock Ln
- 204 SE Shamrock Ln
- 2605 SE 3rd St
- 2608 SE 3rd St
- 104 SE Shamrock Ln
- 2609 SE 3rd St
- 2601 SE 4th St
- 109 SE Shamrock Ln
- 2612 SE 3rd St
- 313 SE Shawn Ct